Shoshone vs Immigrants from Kuwait 2 or more Vehicles in Household

COMPARE

Shoshone
Race
Ancestry
AfghanAfricanAlaska NativeAlaskan AthabascanAlbanianAleutAlsatianAmericanApacheArabArapahoArgentineanArmenianAssyrian/Chaldean/SyriacAustralianAustrianBahamianBangladeshiBarbadianBasqueBelgianBelizeanBermudanBhutaneseBlackfeetBolivianBrazilianBritishBritish West IndianBulgarianBurmeseCajunCambodianCanadianCape VerdeanCarpatho RusynCelticCentral AmericanCentral American IndianCherokeeCheyenneChickasawChileanChineseChippewaChoctawColombianColvilleComancheCosta RicanCreeCreekCroatianCrowCubanCypriotCzechCzechoslovakianDanishDelawareDominicanDutchDutch West IndianEastern EuropeanEcuadorianEgyptianEnglishEstonianEthiopianEuropeanFijianFilipinoFinnishFrenchFrench American IndianFrench CanadianGermanGerman RussianGhanaianGreekGuamanian/ChamorroGuatemalanGuyaneseHaitianHmongHonduranHopiHoumaHungarianIcelanderIndian (Asian)IndonesianInupiatIranianIraqiIrishIroquoisIsraeliItalianJamaicanJapaneseJordanianKenyanKiowaKoreanLaotianLatvianLebaneseLiberianLithuanianLumbeeLuxembourgerMacedonianMalaysianMalteseMarshalleseMenomineeMexicanMexican American IndianMongolianMoroccanNative HawaiianNavajoNepaleseNew ZealanderNicaraguanNigerianNorthern EuropeanNorwegianOkinawanOsageOttawaPaiutePakistaniPalestinianPanamanianParaguayanPennsylvania GermanPeruvianPimaPolishPortuguesePotawatomiPuebloPuerto RicanPuget Sound SalishRomanianRussianSalvadoranSamoanScandinavianScotch-IrishScottishSeminoleSenegaleseSerbianShoshoneSierra LeoneanSiouxSlavicSlovakSloveneSomaliSouth AfricanSouth AmericanSouth American IndianSoviet UnionSpaniardSpanishSpanish AmericanSpanish American IndianSri LankanSubsaharan AfricanSudaneseSwedishSwissSyrianTaiwaneseThaiTlingit-HaidaTohono O'OdhamTonganTrinidadian and TobagonianTsimshianTurkishU.S. Virgin IslanderUgandanUkrainianUruguayanUteVenezuelanVietnameseWelshWest IndianYakamaYaquiYugoslavianYumanYup'ikZimbabwean
Immigration
NonimmigrantsImmigrantsAfghanistanAfricaAlbaniaArgentinaArmeniaAsiaAustraliaAustriaBahamasBangladeshBarbadosBelarusBelgiumBelizeBoliviaBosnia and HerzegovinaBrazilBulgariaBurma/MyanmarCabo VerdeCambodiaCameroonCanadaCaribbeanCentral AmericaChileChinaColombiaCongoCosta RicaCroatiaCubaCzechoslovakiaDenmarkDominicaDominican RepublicEastern AfricaEastern AsiaEastern EuropeEcuadorEgyptEl SalvadorEnglandEritreaEthiopiaEuropeFijiFranceGermanyGhanaGreeceGrenadaGuatemalaGuyanaHaitiHondurasHong KongHungaryIndiaIndonesiaIranIraqIrelandIsraelItalyJamaicaJapanJordanKazakhstanKenyaKoreaLaosLatin AmericaLatviaLebanonLiberiaLithuaniaMalaysiaMexicoMicronesiaMiddle AfricaMoldovaMoroccoNepalNetherlandsNicaraguaNigeriaNorth AmericaNorth MacedoniaNorthern AfricaNorthern EuropeNorwayOceaniaPakistanPanamaPeruPhilippinesPolandPortugalRomaniaRussiaSaudi ArabiaScotlandSenegalSerbiaSierra LeoneSingaporeSomaliaSouth AfricaSouth AmericaSouth Central AsiaSouth Eastern AsiaSouthern EuropeSpainSri LankaSt. Vincent and the GrenadinesSudanSwedenSwitzerlandSyriaTaiwanThailandTrinidad and TobagoTurkeyUgandaUkraineUruguayUzbekistanVenezuelaVietnamWest IndiesWestern AfricaWestern AsiaWestern EuropeYemenZaireZimbabweAzores
Immigrants from Kuwait
Race
Ancestry
AfghanAfricanAlaska NativeAlaskan AthabascanAlbanianAleutAlsatianAmericanApacheArabArapahoArgentineanArmenianAssyrian/Chaldean/SyriacAustralianAustrianBahamianBangladeshiBarbadianBasqueBelgianBelizeanBermudanBhutaneseBlackfeetBolivianBrazilianBritishBritish West IndianBulgarianBurmeseCajunCambodianCanadianCape VerdeanCarpatho RusynCelticCentral AmericanCentral American IndianCherokeeCheyenneChickasawChileanChineseChippewaChoctawColombianColvilleComancheCosta RicanCreeCreekCroatianCrowCubanCypriotCzechCzechoslovakianDanishDelawareDominicanDutchDutch West IndianEastern EuropeanEcuadorianEgyptianEnglishEstonianEthiopianEuropeanFijianFilipinoFinnishFrenchFrench American IndianFrench CanadianGermanGerman RussianGhanaianGreekGuamanian/ChamorroGuatemalanGuyaneseHaitianHmongHonduranHopiHoumaHungarianIcelanderIndian (Asian)IndonesianInupiatIranianIraqiIrishIroquoisIsraeliItalianJamaicanJapaneseJordanianKenyanKiowaKoreanLaotianLatvianLebaneseLiberianLithuanianLumbeeLuxembourgerMacedonianMalaysianMalteseMarshalleseMenomineeMexicanMexican American IndianMongolianMoroccanNative HawaiianNavajoNepaleseNew ZealanderNicaraguanNigerianNorthern EuropeanNorwegianOkinawanOsageOttawaPaiutePakistaniPalestinianPanamanianParaguayanPennsylvania GermanPeruvianPimaPolishPortuguesePotawatomiPuebloPuerto RicanPuget Sound SalishRomanianRussianSalvadoranSamoanScandinavianScotch-IrishScottishSeminoleSenegaleseSerbianSierra LeoneanSiouxSlavicSlovakSloveneSomaliSouth AfricanSouth AmericanSouth American IndianSoviet UnionSpaniardSpanishSpanish AmericanSpanish American IndianSri LankanSubsaharan AfricanSudaneseSwedishSwissSyrianTaiwaneseThaiTlingit-HaidaTohono O'OdhamTonganTrinidadian and TobagonianTsimshianTurkishU.S. Virgin IslanderUgandanUkrainianUruguayanUteVenezuelanVietnameseWelshWest IndianYakamaYaquiYugoslavianYumanYup'ikZimbabwean
Immigration
NonimmigrantsImmigrantsAfghanistanAfricaAlbaniaArgentinaArmeniaAsiaAustraliaAustriaBahamasBangladeshBarbadosBelarusBelgiumBelizeBoliviaBosnia and HerzegovinaBrazilBulgariaBurma/MyanmarCabo VerdeCambodiaCameroonCanadaCaribbeanCentral AmericaChileChinaColombiaCongoCosta RicaCroatiaCubaCzechoslovakiaDenmarkDominicaDominican RepublicEastern AfricaEastern AsiaEastern EuropeEcuadorEgyptEl SalvadorEnglandEritreaEthiopiaEuropeFijiFranceGermanyGhanaGreeceGrenadaGuatemalaGuyanaHaitiHondurasHong KongHungaryIndiaIndonesiaIranIraqIrelandIsraelItalyJamaicaJapanJordanKazakhstanKenyaKoreaKuwaitLaosLatin AmericaLatviaLebanonLiberiaLithuaniaMalaysiaMexicoMicronesiaMiddle AfricaMoldovaMoroccoNepalNetherlandsNicaraguaNigeriaNorth AmericaNorth MacedoniaNorthern AfricaNorthern EuropeNorwayOceaniaPakistanPanamaPeruPhilippinesPolandPortugalRomaniaRussiaSaudi ArabiaScotlandSenegalSerbiaSierra LeoneSingaporeSomaliaSouth AfricaSouth AmericaSouth Central AsiaSouth Eastern AsiaSouthern EuropeSpainSri LankaSt. Vincent and the GrenadinesSudanSwedenSwitzerlandSyriaTaiwanThailandTrinidad and TobagoTurkeyUgandaUkraineUruguayUzbekistanVenezuelaVietnamWest IndiesWestern AfricaWestern AsiaWestern EuropeYemenZaireZimbabweAzores
2 or more Vehicles in Household
Income
Poverty
Unemployment
Labor Participation
Family Structure
Vehicle Availability
Education Level
Disability

2 or more Vehicles in Household Comparison

Shoshone

Immigrants from Kuwait

Exceptional
Good
57.9%
2 OR MORE VEHICLES IN HOUSEHOLD
99.0/ 100
METRIC RATING
92nd/ 347
METRIC RANK
55.8%
2 OR MORE VEHICLES IN HOUSEHOLD
70.2/ 100
METRIC RATING
157th/ 347
METRIC RANK

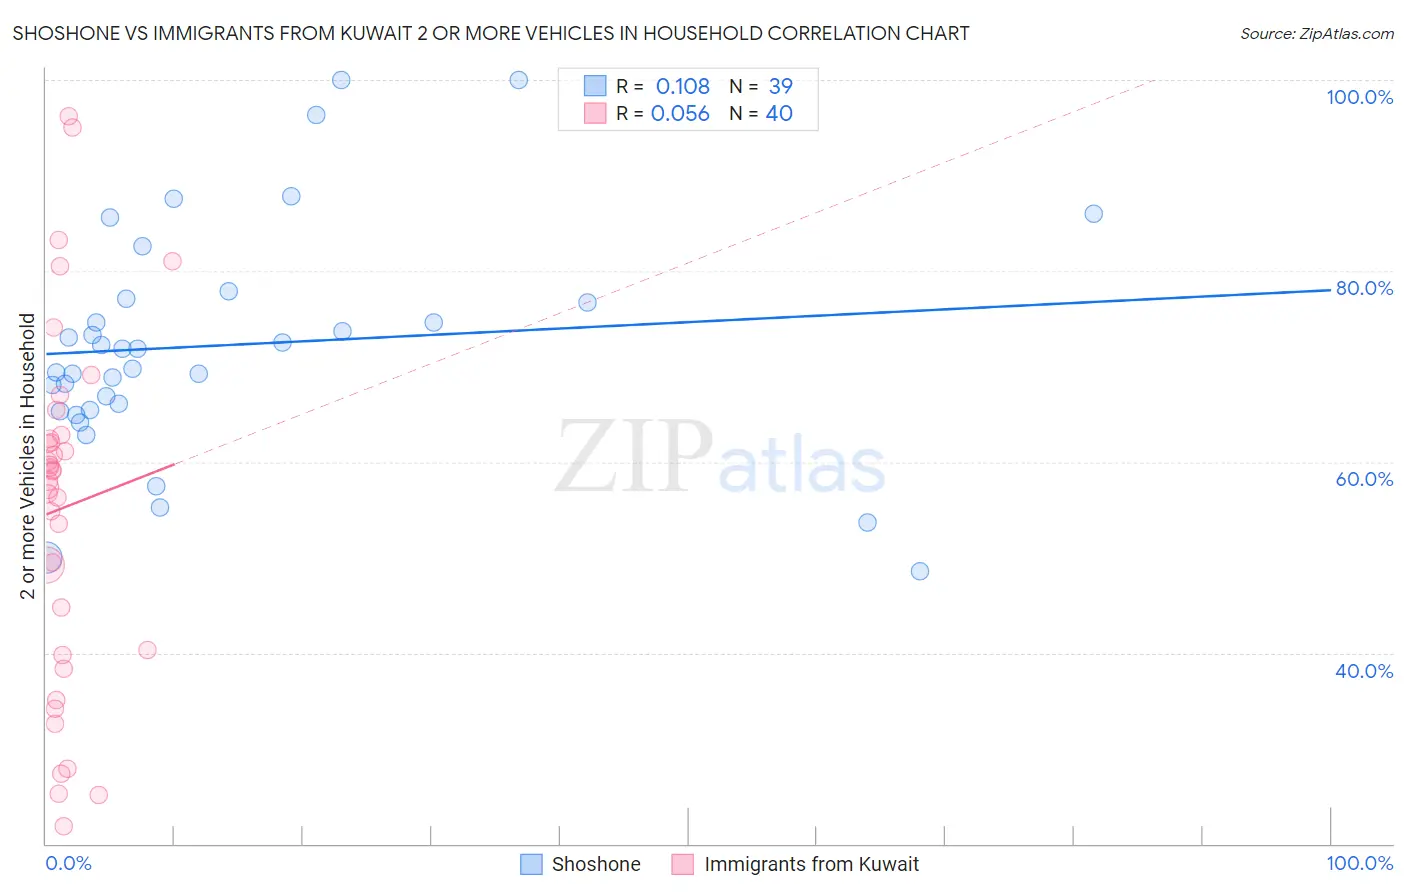
Shoshone vs Immigrants from Kuwait 2 or more Vehicles in Household Correlation Chart

The statistical analysis conducted on geographies consisting of 66,615,877 people shows a poor positive correlation between the proportion of Shoshone and percentage of households with 2 or more vehicles available in the United States with a correlation coefficient (R) of 0.108 and weighted average of 57.9%. Similarly, the statistical analysis conducted on geographies consisting of 136,894,640 people shows a slight positive correlation between the proportion of Immigrants from Kuwait and percentage of households with 2 or more vehicles available in the United States with a correlation coefficient (R) of 0.056 and weighted average of 55.8%, a difference of 3.7%.
Shoshone vs Immigrants from Kuwait 2 or more Vehicles in Household

2 or more Vehicles in Household Correlation Summary

MeasurementShoshoneImmigrants from Kuwait
Minimum48.5%21.8%
Maximum100.0%96.2%
Range51.5%74.4%
Mean72.3%55.2%
Median71.8%58.5%
Interquartile 25% (IQ1)65.4%40.0%
Interquartile 75% (IQ3)77.1%62.6%
Interquartile Range (IQR)11.7%22.7%
Standard Deviation (Sample)12.1%18.4%
Standard Deviation (Population)11.9%18.2%

Similar Demographics by 2 or more Vehicles in Household

Demographics Similar to Shoshone by 2 or more Vehicles in Household

In terms of 2 or more vehicles in household, the demographic groups most similar to Shoshone are Ottawa (57.9%, a difference of 0.0%), Pakistani (57.9%, a difference of 0.020%), Immigrants from Germany (57.9%, a difference of 0.050%), Hispanic or Latino (57.9%, a difference of 0.050%), and Filipino (57.8%, a difference of 0.060%).
DemographicsRating | Rank2 or more Vehicles in Household
Slovaks
99.2
/100
|
#85
Exceptional
58.0%
Potawatomi
99.1
/100
|
#86
Exceptional
58.0%
Thais
99.1
/100
|
#87
Exceptional
57.9%
Immigrants | Iran
99.1
/100
|
#88
Exceptional
57.9%
Immigrants | Germany
99.0
/100
|
#89
Exceptional
57.9%
Hispanics or Latinos
99.0
/100
|
#90
Exceptional
57.9%
Pakistanis
99.0
/100
|
#91
Exceptional
57.9%
Shoshone
99.0
/100
|
#92
Exceptional
57.9%
Ottawa
99.0
/100
|
#93
Exceptional
57.9%
Filipinos
98.9
/100
|
#94
Exceptional
57.8%
Hmong
98.9
/100
|
#95
Exceptional
57.8%
Burmese
98.8
/100
|
#96
Exceptional
57.8%
Slavs
98.8
/100
|
#97
Exceptional
57.8%
Palestinians
98.6
/100
|
#98
Exceptional
57.7%
Cajuns
98.5
/100
|
#99
Exceptional
57.7%

Demographics Similar to Immigrants from Kuwait by 2 or more Vehicles in Household

In terms of 2 or more vehicles in household, the demographic groups most similar to Immigrants from Kuwait are Immigrants from Lithuania (55.8%, a difference of 0.010%), Ukrainian (55.8%, a difference of 0.030%), Immigrants from Venezuela (55.8%, a difference of 0.030%), Lumbee (55.9%, a difference of 0.080%), and Tlingit-Haida (55.8%, a difference of 0.080%).
DemographicsRating | Rank2 or more Vehicles in Household
Nicaraguans
79.9
/100
|
#150
Good
56.1%
Immigrants | Northern Europe
78.7
/100
|
#151
Good
56.1%
Immigrants | Pakistan
78.1
/100
|
#152
Good
56.1%
Lumbee
71.9
/100
|
#153
Good
55.9%
Ukrainians
70.8
/100
|
#154
Good
55.8%
Immigrants | Venezuela
70.7
/100
|
#155
Good
55.8%
Immigrants | Lithuania
70.4
/100
|
#156
Good
55.8%
Immigrants | Kuwait
70.2
/100
|
#157
Good
55.8%
Tlingit-Haida
68.5
/100
|
#158
Good
55.8%
Paiute
68.0
/100
|
#159
Good
55.8%
Crow
67.0
/100
|
#160
Good
55.7%
Colville
61.1
/100
|
#161
Good
55.6%
German Russians
60.9
/100
|
#162
Good
55.6%
Immigrants | Zimbabwe
60.2
/100
|
#163
Good
55.6%
Dutch West Indians
59.8
/100
|
#164
Average
55.6%