Shoshone vs Immigrants from Kuwait Female Unemployment
COMPARE
Shoshone
Immigrants from Kuwait
Female Unemployment
Female Unemployment Comparison
Shoshone
Immigrants from Kuwait
6.2%
FEMALE UNEMPLOYMENT
0.0/ 100
METRIC RATING
307th/ 347
METRIC RANK
5.0%
FEMALE UNEMPLOYMENT
95.2/ 100
METRIC RATING
98th/ 347
METRIC RANK
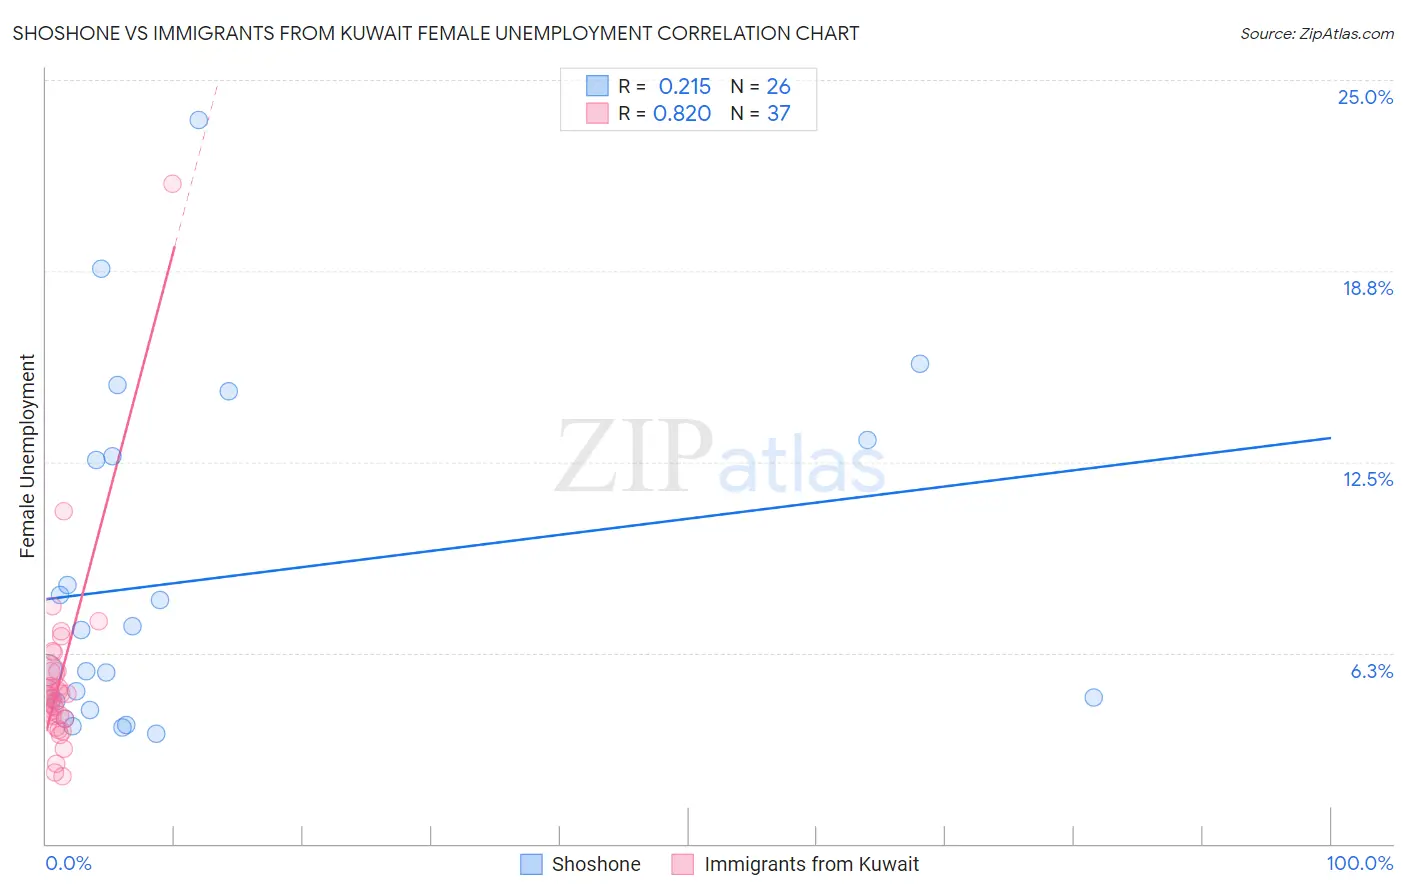
Shoshone vs Immigrants from Kuwait Female Unemployment Correlation Chart
The statistical analysis conducted on geographies consisting of 66,499,639 people shows a weak positive correlation between the proportion of Shoshone and unemploymnet rate among females in the United States with a correlation coefficient (R) of 0.215 and weighted average of 6.2%. Similarly, the statistical analysis conducted on geographies consisting of 136,847,491 people shows a very strong positive correlation between the proportion of Immigrants from Kuwait and unemploymnet rate among females in the United States with a correlation coefficient (R) of 0.820 and weighted average of 5.0%, a difference of 24.0%.
Female Unemployment Correlation Summary
| Measurement | Shoshone | Immigrants from Kuwait |
| Minimum | 3.6% | 2.2% |
| Maximum | 23.7% | 21.6% |
| Range | 20.1% | 19.4% |
| Mean | 8.7% | 5.4% |
| Median | 6.3% | 4.9% |
| Interquartile 25% (IQ1) | 4.7% | 4.1% |
| Interquartile 75% (IQ3) | 12.7% | 5.6% |
| Interquartile Range (IQR) | 8.0% | 1.5% |
| Standard Deviation (Sample) | 5.4% | 3.2% |
| Standard Deviation (Population) | 5.3% | 3.1% |
Similar Demographics by Female Unemployment
Demographics Similar to Shoshone by Female Unemployment
In terms of female unemployment, the demographic groups most similar to Shoshone are Immigrants from Central America (6.2%, a difference of 0.010%), Hispanic or Latino (6.2%, a difference of 0.060%), Spanish American Indian (6.2%, a difference of 0.17%), Immigrants from Jamaica (6.2%, a difference of 0.23%), and Barbadian (6.2%, a difference of 0.59%).
| Demographics | Rating | Rank | Female Unemployment |
| Immigrants | Haiti | 0.0 /100 | #300 | Tragic 6.1% |
| Immigrants | Barbados | 0.0 /100 | #301 | Tragic 6.2% |
| U.S. Virgin Islanders | 0.0 /100 | #302 | Tragic 6.2% |
| Barbadians | 0.0 /100 | #303 | Tragic 6.2% |
| Immigrants | Jamaica | 0.0 /100 | #304 | Tragic 6.2% |
| Spanish American Indians | 0.0 /100 | #305 | Tragic 6.2% |
| Immigrants | Central America | 0.0 /100 | #306 | Tragic 6.2% |
| Shoshone | 0.0 /100 | #307 | Tragic 6.2% |
| Hispanics or Latinos | 0.0 /100 | #308 | Tragic 6.2% |
| Ecuadorians | 0.0 /100 | #309 | Tragic 6.3% |
| Central American Indians | 0.0 /100 | #310 | Tragic 6.3% |
| Immigrants | Mexico | 0.0 /100 | #311 | Tragic 6.3% |
| Immigrants | Grenada | 0.0 /100 | #312 | Tragic 6.3% |
| Belizeans | 0.0 /100 | #313 | Tragic 6.3% |
| Immigrants | Ecuador | 0.0 /100 | #314 | Tragic 6.4% |
Demographics Similar to Immigrants from Kuwait by Female Unemployment
In terms of female unemployment, the demographic groups most similar to Immigrants from Kuwait are Immigrants from Somalia (5.0%, a difference of 0.0%), Immigrants from Zaire (5.0%, a difference of 0.010%), Indonesian (5.0%, a difference of 0.030%), Immigrants from Czechoslovakia (5.0%, a difference of 0.070%), and Immigrants from South Central Asia (5.0%, a difference of 0.11%).
| Demographics | Rating | Rank | Female Unemployment |
| Immigrants | Japan | 96.0 /100 | #91 | Exceptional 5.0% |
| Romanians | 95.9 /100 | #92 | Exceptional 5.0% |
| Immigrants | Austria | 95.7 /100 | #93 | Exceptional 5.0% |
| Immigrants | Malaysia | 95.7 /100 | #94 | Exceptional 5.0% |
| Burmese | 95.6 /100 | #95 | Exceptional 5.0% |
| Immigrants | South Central Asia | 95.5 /100 | #96 | Exceptional 5.0% |
| Immigrants | Somalia | 95.2 /100 | #97 | Exceptional 5.0% |
| Immigrants | Kuwait | 95.2 /100 | #98 | Exceptional 5.0% |
| Immigrants | Zaire | 95.2 /100 | #99 | Exceptional 5.0% |
| Indonesians | 95.1 /100 | #100 | Exceptional 5.0% |
| Immigrants | Czechoslovakia | 95.0 /100 | #101 | Exceptional 5.0% |
| Immigrants | Kenya | 94.8 /100 | #102 | Exceptional 5.0% |
| Somalis | 94.6 /100 | #103 | Exceptional 5.0% |
| Kenyans | 93.7 /100 | #104 | Exceptional 5.0% |
| Immigrants | England | 93.6 /100 | #105 | Exceptional 5.0% |