Egyptian vs Immigrants from Kuwait 2 or more Vehicles in Household
COMPARE
Egyptian
Immigrants from Kuwait
2 or more Vehicles in Household
2 or more Vehicles in Household Comparison
Egyptians
Immigrants from Kuwait
54.3%
2 OR MORE VEHICLES IN HOUSEHOLD
12.0/ 100
METRIC RATING
208th/ 347
METRIC RANK
55.8%
2 OR MORE VEHICLES IN HOUSEHOLD
70.2/ 100
METRIC RATING
157th/ 347
METRIC RANK
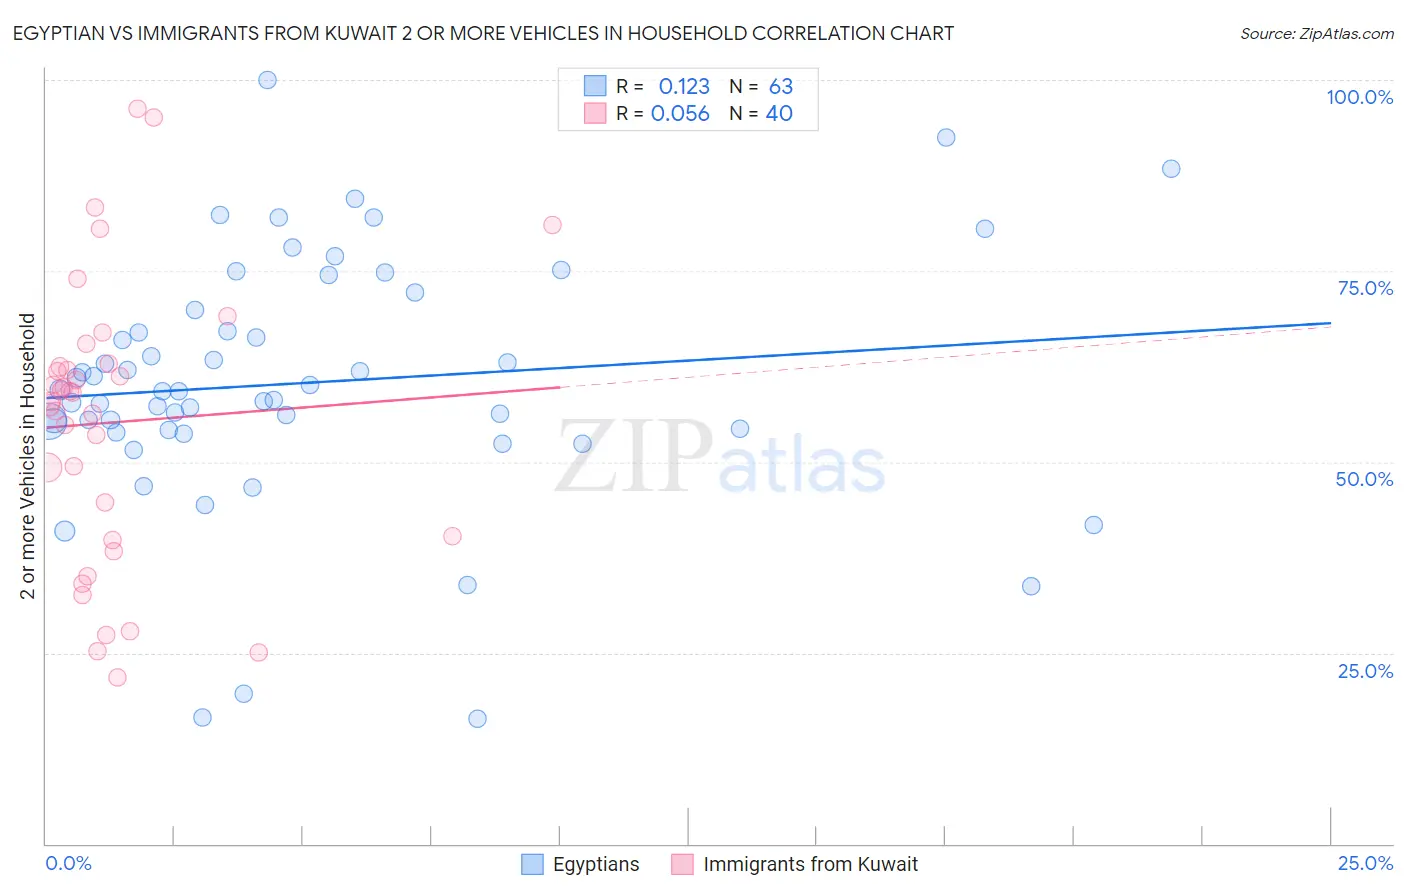
Egyptian vs Immigrants from Kuwait 2 or more Vehicles in Household Correlation Chart
The statistical analysis conducted on geographies consisting of 276,797,335 people shows a poor positive correlation between the proportion of Egyptians and percentage of households with 2 or more vehicles available in the United States with a correlation coefficient (R) of 0.123 and weighted average of 54.3%. Similarly, the statistical analysis conducted on geographies consisting of 136,894,640 people shows a slight positive correlation between the proportion of Immigrants from Kuwait and percentage of households with 2 or more vehicles available in the United States with a correlation coefficient (R) of 0.056 and weighted average of 55.8%, a difference of 2.9%.
2 or more Vehicles in Household Correlation Summary
| Measurement | Egyptian | Immigrants from Kuwait |
| Minimum | 16.3% | 21.8% |
| Maximum | 100.0% | 96.2% |
| Range | 83.7% | 74.4% |
| Mean | 60.4% | 55.2% |
| Median | 59.3% | 58.5% |
| Interquartile 25% (IQ1) | 54.2% | 40.0% |
| Interquartile 75% (IQ3) | 69.9% | 62.6% |
| Interquartile Range (IQR) | 15.6% | 22.7% |
| Standard Deviation (Sample) | 16.3% | 18.4% |
| Standard Deviation (Population) | 16.2% | 18.2% |
Similar Demographics by 2 or more Vehicles in Household
Demographics Similar to Egyptians by 2 or more Vehicles in Household
In terms of 2 or more vehicles in household, the demographic groups most similar to Egyptians are Immigrants from Bulgaria (54.3%, a difference of 0.0%), Immigrants from Saudi Arabia (54.2%, a difference of 0.060%), Immigrants from Hungary (54.2%, a difference of 0.070%), Turkish (54.3%, a difference of 0.090%), and Immigrants from Chile (54.2%, a difference of 0.090%).
| Demographics | Rating | Rank | 2 or more Vehicles in Household |
| Immigrants | Italy | 15.5 /100 | #201 | Poor 54.4% |
| Immigrants | North Macedonia | 14.9 /100 | #202 | Poor 54.4% |
| Immigrants | Peru | 14.3 /100 | #203 | Poor 54.4% |
| Immigrants | Belgium | 13.7 /100 | #204 | Poor 54.3% |
| Cheyenne | 13.6 /100 | #205 | Poor 54.3% |
| Immigrants | Latin America | 13.1 /100 | #206 | Poor 54.3% |
| Turks | 13.0 /100 | #207 | Poor 54.3% |
| Egyptians | 12.0 /100 | #208 | Poor 54.3% |
| Immigrants | Bulgaria | 12.0 /100 | #209 | Poor 54.3% |
| Immigrants | Saudi Arabia | 11.3 /100 | #210 | Poor 54.2% |
| Immigrants | Hungary | 11.3 /100 | #211 | Poor 54.2% |
| Immigrants | Chile | 11.1 /100 | #212 | Poor 54.2% |
| Guatemalans | 9.6 /100 | #213 | Tragic 54.1% |
| Immigrants | Czechoslovakia | 9.4 /100 | #214 | Tragic 54.1% |
| Aleuts | 9.3 /100 | #215 | Tragic 54.1% |
Demographics Similar to Immigrants from Kuwait by 2 or more Vehicles in Household
In terms of 2 or more vehicles in household, the demographic groups most similar to Immigrants from Kuwait are Immigrants from Lithuania (55.8%, a difference of 0.010%), Ukrainian (55.8%, a difference of 0.030%), Immigrants from Venezuela (55.8%, a difference of 0.030%), Lumbee (55.9%, a difference of 0.080%), and Tlingit-Haida (55.8%, a difference of 0.080%).
| Demographics | Rating | Rank | 2 or more Vehicles in Household |
| Nicaraguans | 79.9 /100 | #150 | Good 56.1% |
| Immigrants | Northern Europe | 78.7 /100 | #151 | Good 56.1% |
| Immigrants | Pakistan | 78.1 /100 | #152 | Good 56.1% |
| Lumbee | 71.9 /100 | #153 | Good 55.9% |
| Ukrainians | 70.8 /100 | #154 | Good 55.8% |
| Immigrants | Venezuela | 70.7 /100 | #155 | Good 55.8% |
| Immigrants | Lithuania | 70.4 /100 | #156 | Good 55.8% |
| Immigrants | Kuwait | 70.2 /100 | #157 | Good 55.8% |
| Tlingit-Haida | 68.5 /100 | #158 | Good 55.8% |
| Paiute | 68.0 /100 | #159 | Good 55.8% |
| Crow | 67.0 /100 | #160 | Good 55.7% |
| Colville | 61.1 /100 | #161 | Good 55.6% |
| German Russians | 60.9 /100 | #162 | Good 55.6% |
| Immigrants | Zimbabwe | 60.2 /100 | #163 | Good 55.6% |
| Dutch West Indians | 59.8 /100 | #164 | Average 55.6% |