Shoshone vs Immigrants from Albania 2 or more Vehicles in Household
COMPARE
Shoshone
Immigrants from Albania
2 or more Vehicles in Household
2 or more Vehicles in Household Comparison
Shoshone
Immigrants from Albania
57.9%
2 OR MORE VEHICLES IN HOUSEHOLD
99.0/ 100
METRIC RATING
92nd/ 347
METRIC RANK
46.0%
2 OR MORE VEHICLES IN HOUSEHOLD
0.0/ 100
METRIC RATING
318th/ 347
METRIC RANK
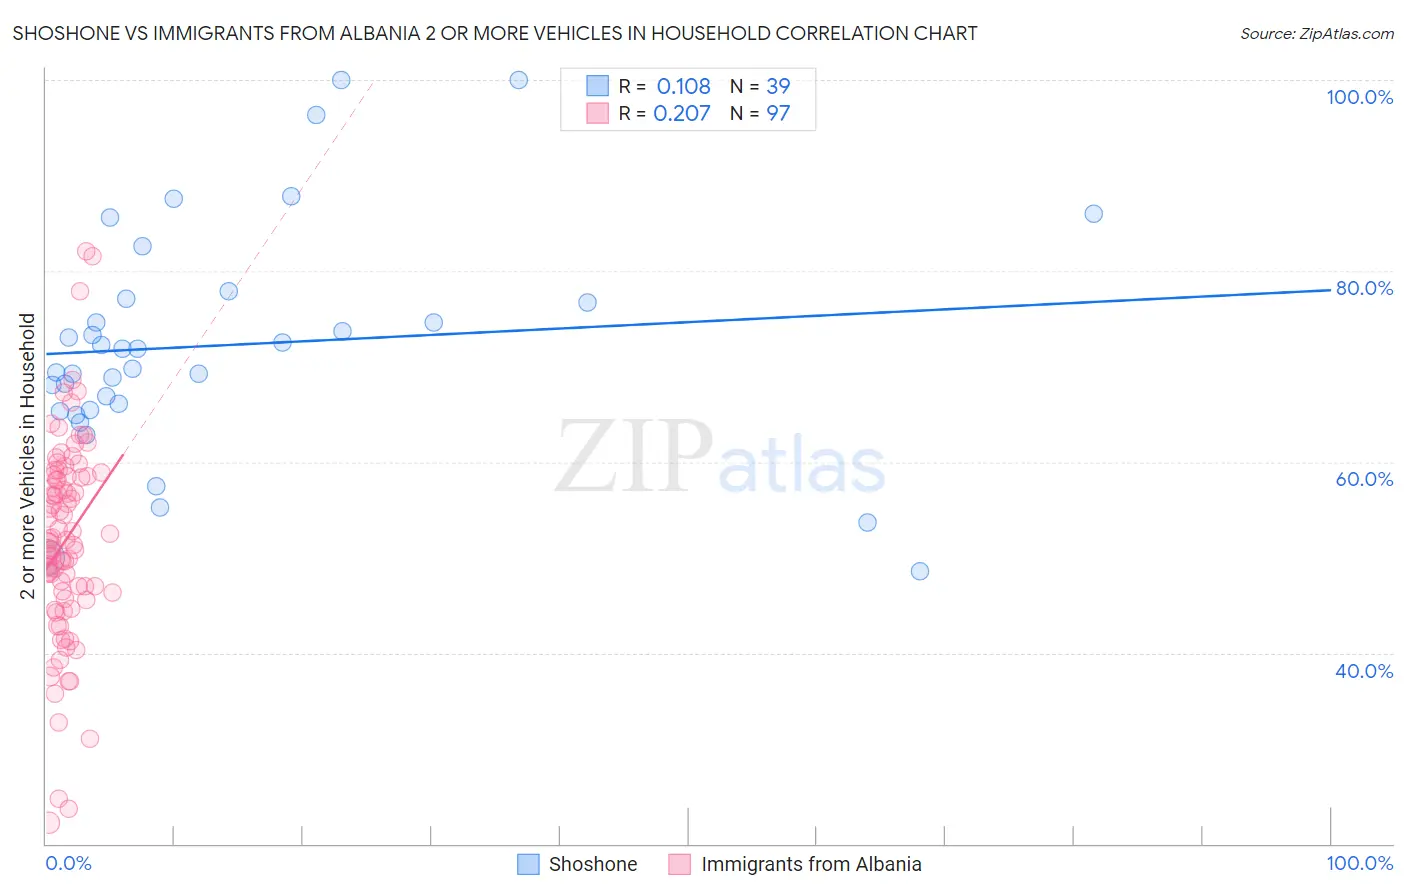
Shoshone vs Immigrants from Albania 2 or more Vehicles in Household Correlation Chart
The statistical analysis conducted on geographies consisting of 66,615,877 people shows a poor positive correlation between the proportion of Shoshone and percentage of households with 2 or more vehicles available in the United States with a correlation coefficient (R) of 0.108 and weighted average of 57.9%. Similarly, the statistical analysis conducted on geographies consisting of 119,187,610 people shows a weak positive correlation between the proportion of Immigrants from Albania and percentage of households with 2 or more vehicles available in the United States with a correlation coefficient (R) of 0.207 and weighted average of 46.0%, a difference of 25.8%.
2 or more Vehicles in Household Correlation Summary
| Measurement | Shoshone | Immigrants from Albania |
| Minimum | 48.5% | 22.2% |
| Maximum | 100.0% | 82.0% |
| Range | 51.5% | 59.8% |
| Mean | 72.3% | 51.7% |
| Median | 71.8% | 51.5% |
| Interquartile 25% (IQ1) | 65.4% | 46.0% |
| Interquartile 75% (IQ3) | 77.1% | 58.5% |
| Interquartile Range (IQR) | 11.7% | 12.5% |
| Standard Deviation (Sample) | 12.1% | 10.7% |
| Standard Deviation (Population) | 11.9% | 10.7% |
Similar Demographics by 2 or more Vehicles in Household
Demographics Similar to Shoshone by 2 or more Vehicles in Household
In terms of 2 or more vehicles in household, the demographic groups most similar to Shoshone are Ottawa (57.9%, a difference of 0.0%), Pakistani (57.9%, a difference of 0.020%), Immigrants from Germany (57.9%, a difference of 0.050%), Hispanic or Latino (57.9%, a difference of 0.050%), and Filipino (57.8%, a difference of 0.060%).
| Demographics | Rating | Rank | 2 or more Vehicles in Household |
| Slovaks | 99.2 /100 | #85 | Exceptional 58.0% |
| Potawatomi | 99.1 /100 | #86 | Exceptional 58.0% |
| Thais | 99.1 /100 | #87 | Exceptional 57.9% |
| Immigrants | Iran | 99.1 /100 | #88 | Exceptional 57.9% |
| Immigrants | Germany | 99.0 /100 | #89 | Exceptional 57.9% |
| Hispanics or Latinos | 99.0 /100 | #90 | Exceptional 57.9% |
| Pakistanis | 99.0 /100 | #91 | Exceptional 57.9% |
| Shoshone | 99.0 /100 | #92 | Exceptional 57.9% |
| Ottawa | 99.0 /100 | #93 | Exceptional 57.9% |
| Filipinos | 98.9 /100 | #94 | Exceptional 57.8% |
| Hmong | 98.9 /100 | #95 | Exceptional 57.8% |
| Burmese | 98.8 /100 | #96 | Exceptional 57.8% |
| Slavs | 98.8 /100 | #97 | Exceptional 57.8% |
| Palestinians | 98.6 /100 | #98 | Exceptional 57.7% |
| Cajuns | 98.5 /100 | #99 | Exceptional 57.7% |
Demographics Similar to Immigrants from Albania by 2 or more Vehicles in Household
In terms of 2 or more vehicles in household, the demographic groups most similar to Immigrants from Albania are Jamaican (45.8%, a difference of 0.52%), Soviet Union (45.7%, a difference of 0.58%), Immigrants from Haiti (46.5%, a difference of 1.1%), Cape Verdean (46.8%, a difference of 1.7%), and Puerto Rican (47.1%, a difference of 2.4%).
| Demographics | Rating | Rank | 2 or more Vehicles in Household |
| Immigrants | Belarus | 0.0 /100 | #311 | Tragic 47.9% |
| Haitians | 0.0 /100 | #312 | Tragic 47.6% |
| U.S. Virgin Islanders | 0.0 /100 | #313 | Tragic 47.5% |
| Immigrants | Ghana | 0.0 /100 | #314 | Tragic 47.4% |
| Puerto Ricans | 0.0 /100 | #315 | Tragic 47.1% |
| Cape Verdeans | 0.0 /100 | #316 | Tragic 46.8% |
| Immigrants | Haiti | 0.0 /100 | #317 | Tragic 46.5% |
| Immigrants | Albania | 0.0 /100 | #318 | Tragic 46.0% |
| Jamaicans | 0.0 /100 | #319 | Tragic 45.8% |
| Soviet Union | 0.0 /100 | #320 | Tragic 45.7% |
| Immigrants | Jamaica | 0.0 /100 | #321 | Tragic 44.5% |
| Senegalese | 0.0 /100 | #322 | Tragic 44.2% |
| Immigrants | Caribbean | 0.0 /100 | #323 | Tragic 44.2% |
| Immigrants | Cabo Verde | 0.0 /100 | #324 | Tragic 43.3% |
| Immigrants | West Indies | 0.0 /100 | #325 | Tragic 43.1% |