Shoshone vs Immigrants from Kuwait Unemployment Among Ages 25 to 29 years
COMPARE
Shoshone
Immigrants from Kuwait
Unemployment Among Ages 25 to 29 years
Unemployment Among Ages 25 to 29 years Comparison
Shoshone
Immigrants from Kuwait
9.2%
UNEMPLOYMENT AMONG AGES 25 TO 29 YEARS
0.0/ 100
METRIC RATING
326th/ 347
METRIC RANK
5.9%
UNEMPLOYMENT AMONG AGES 25 TO 29 YEARS
99.9/ 100
METRIC RATING
14th/ 347
METRIC RANK
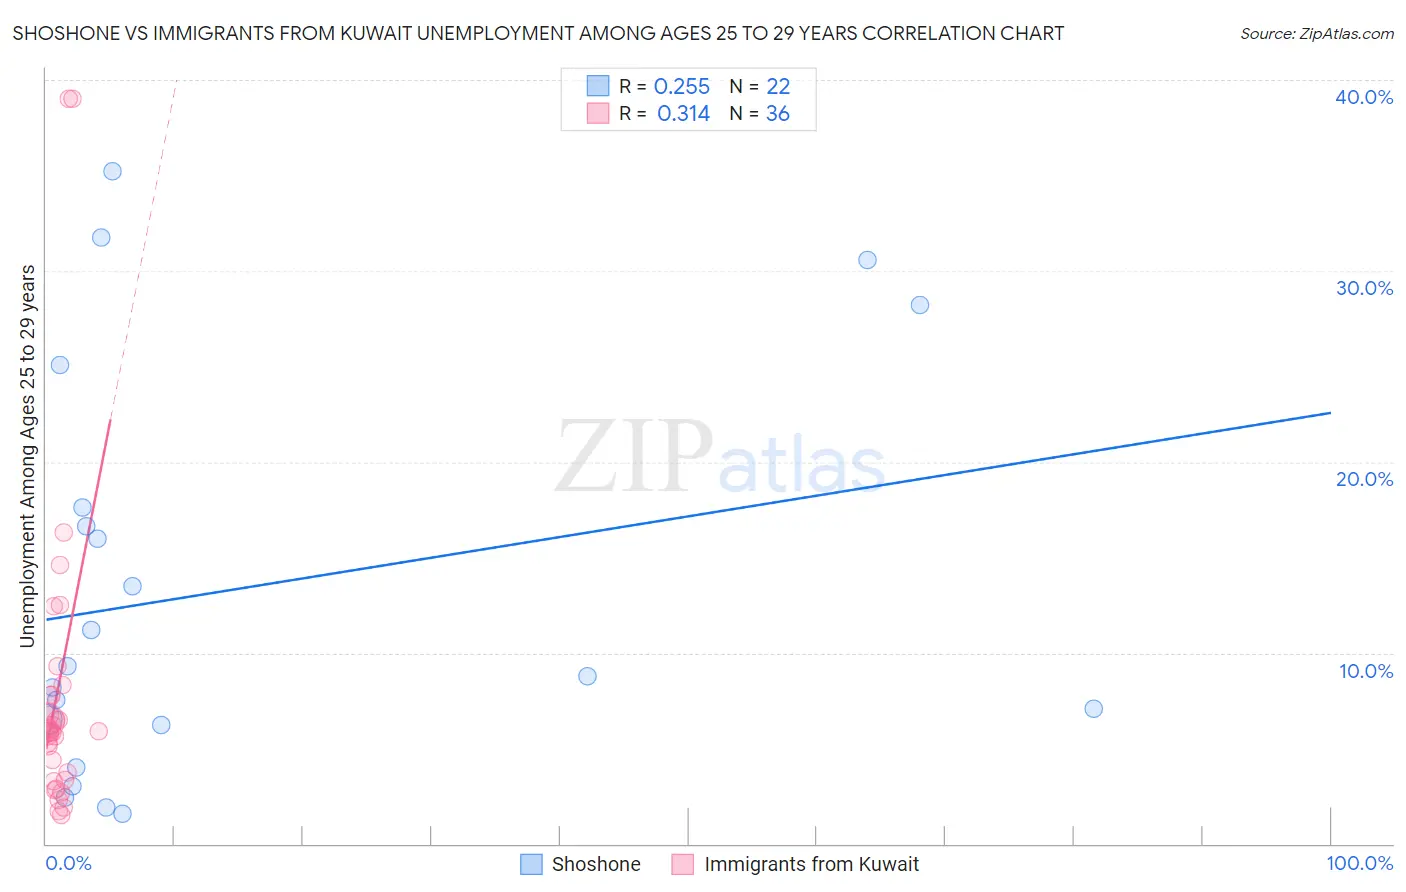
Shoshone vs Immigrants from Kuwait Unemployment Among Ages 25 to 29 years Correlation Chart
The statistical analysis conducted on geographies consisting of 65,507,418 people shows a weak positive correlation between the proportion of Shoshone and unemployment rate among population between the ages 25 and 29 in the United States with a correlation coefficient (R) of 0.255 and weighted average of 9.2%. Similarly, the statistical analysis conducted on geographies consisting of 135,474,180 people shows a mild positive correlation between the proportion of Immigrants from Kuwait and unemployment rate among population between the ages 25 and 29 in the United States with a correlation coefficient (R) of 0.314 and weighted average of 5.9%, a difference of 56.7%.
Unemployment Among Ages 25 to 29 years Correlation Summary
| Measurement | Shoshone | Immigrants from Kuwait |
| Minimum | 1.6% | 1.5% |
| Maximum | 35.2% | 39.0% |
| Range | 33.6% | 37.5% |
| Mean | 13.3% | 8.0% |
| Median | 9.1% | 5.9% |
| Interquartile 25% (IQ1) | 6.2% | 3.5% |
| Interquartile 75% (IQ3) | 17.6% | 7.8% |
| Interquartile Range (IQR) | 11.4% | 4.3% |
| Standard Deviation (Sample) | 10.5% | 8.4% |
| Standard Deviation (Population) | 10.3% | 8.2% |
Similar Demographics by Unemployment Among Ages 25 to 29 years
Demographics Similar to Shoshone by Unemployment Among Ages 25 to 29 years
In terms of unemployment among ages 25 to 29 years, the demographic groups most similar to Shoshone are Colville (9.2%, a difference of 0.16%), Apache (9.5%, a difference of 2.8%), Aleut (9.7%, a difference of 5.0%), Yakama (8.8%, a difference of 5.3%), and Houma (8.7%, a difference of 5.8%).
| Demographics | Rating | Rank | Unemployment Among Ages 25 to 29 years |
| Immigrants | Armenia | 0.0 /100 | #319 | Tragic 8.5% |
| Blacks/African Americans | 0.0 /100 | #320 | Tragic 8.6% |
| Immigrants | Dominican Republic | 0.0 /100 | #321 | Tragic 8.6% |
| Tlingit-Haida | 0.0 /100 | #322 | Tragic 8.7% |
| Dominicans | 0.0 /100 | #323 | Tragic 8.7% |
| Houma | 0.0 /100 | #324 | Tragic 8.7% |
| Yakama | 0.0 /100 | #325 | Tragic 8.8% |
| Shoshone | 0.0 /100 | #326 | Tragic 9.2% |
| Colville | 0.0 /100 | #327 | Tragic 9.2% |
| Apache | 0.0 /100 | #328 | Tragic 9.5% |
| Aleuts | 0.0 /100 | #329 | Tragic 9.7% |
| Natives/Alaskans | 0.0 /100 | #330 | Tragic 9.8% |
| Alaska Natives | 0.0 /100 | #331 | Tragic 10.2% |
| Pueblo | 0.0 /100 | #332 | Tragic 10.4% |
| Alaskan Athabascans | 0.0 /100 | #333 | Tragic 10.8% |
Demographics Similar to Immigrants from Kuwait by Unemployment Among Ages 25 to 29 years
In terms of unemployment among ages 25 to 29 years, the demographic groups most similar to Immigrants from Kuwait are Cuban (5.9%, a difference of 0.35%), Immigrants from Bulgaria (5.9%, a difference of 0.36%), Bolivian (5.9%, a difference of 0.50%), Immigrants from Singapore (5.9%, a difference of 0.61%), and Immigrants from Bolivia (5.9%, a difference of 0.63%).
| Demographics | Rating | Rank | Unemployment Among Ages 25 to 29 years |
| Immigrants | India | 100.0 /100 | #7 | Exceptional 5.7% |
| Immigrants | Bosnia and Herzegovina | 100.0 /100 | #8 | Exceptional 5.7% |
| Immigrants | Nepal | 100.0 /100 | #9 | Exceptional 5.7% |
| Immigrants | Sudan | 100.0 /100 | #10 | Exceptional 5.8% |
| Cambodians | 100.0 /100 | #11 | Exceptional 5.8% |
| Okinawans | 100.0 /100 | #12 | Exceptional 5.9% |
| Immigrants | Bolivia | 100.0 /100 | #13 | Exceptional 5.9% |
| Immigrants | Kuwait | 99.9 /100 | #14 | Exceptional 5.9% |
| Cubans | 99.9 /100 | #15 | Exceptional 5.9% |
| Immigrants | Bulgaria | 99.9 /100 | #16 | Exceptional 5.9% |
| Bolivians | 99.9 /100 | #17 | Exceptional 5.9% |
| Immigrants | Singapore | 99.9 /100 | #18 | Exceptional 5.9% |
| Thais | 99.9 /100 | #19 | Exceptional 5.9% |
| Immigrants | Eritrea | 99.9 /100 | #20 | Exceptional 5.9% |
| Immigrants | Ethiopia | 99.9 /100 | #21 | Exceptional 6.0% |