Shoshone vs Immigrants from Nepal 2 or more Vehicles in Household
COMPARE
Shoshone
Immigrants from Nepal
2 or more Vehicles in Household
2 or more Vehicles in Household Comparison
Shoshone
Immigrants from Nepal
57.9%
2 OR MORE VEHICLES IN HOUSEHOLD
99.0/ 100
METRIC RATING
92nd/ 347
METRIC RANK
53.5%
2 OR MORE VEHICLES IN HOUSEHOLD
3.6/ 100
METRIC RATING
230th/ 347
METRIC RANK
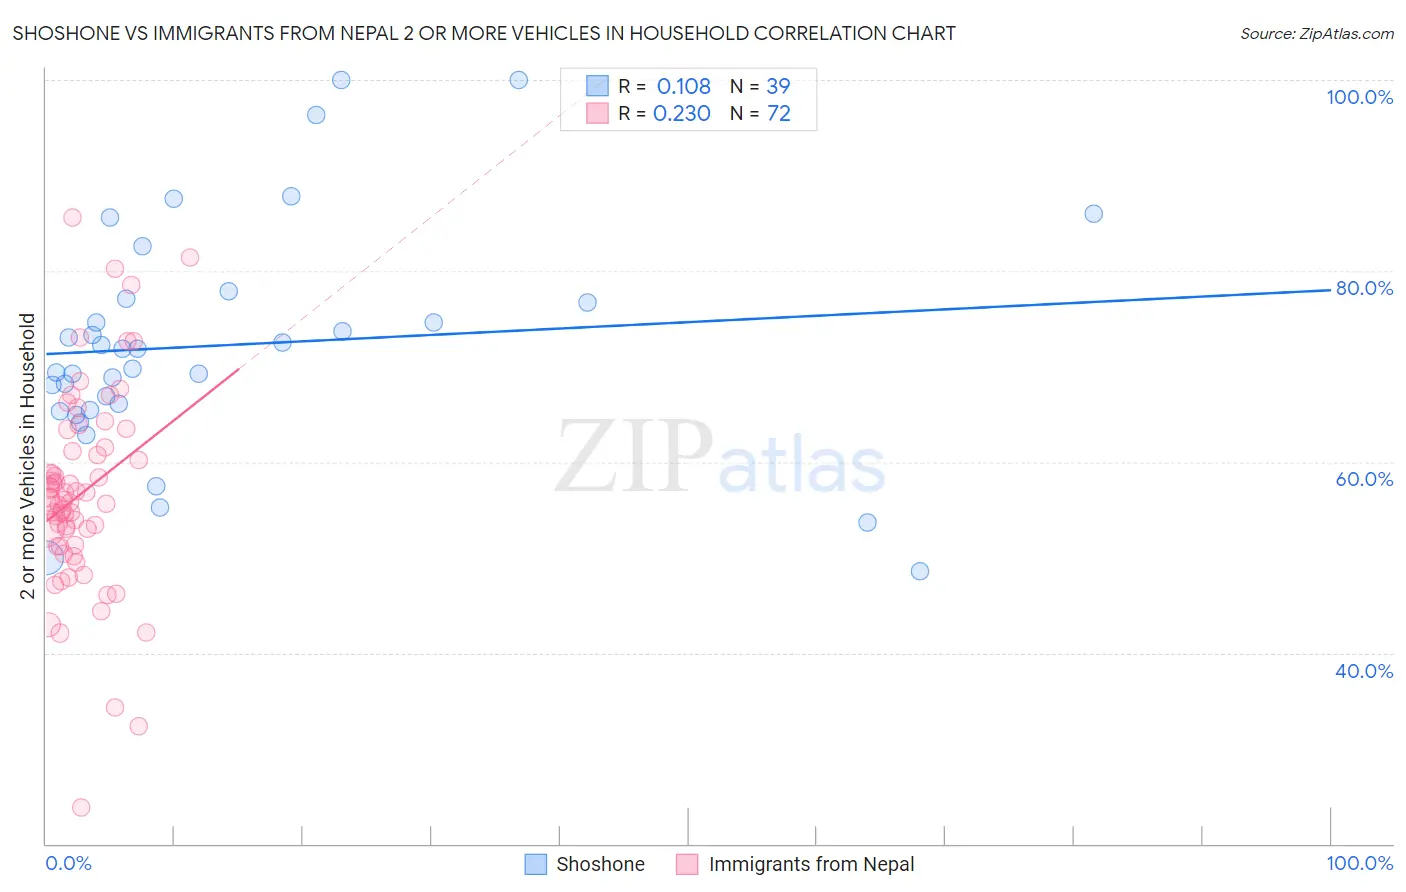
Shoshone vs Immigrants from Nepal 2 or more Vehicles in Household Correlation Chart
The statistical analysis conducted on geographies consisting of 66,615,877 people shows a poor positive correlation between the proportion of Shoshone and percentage of households with 2 or more vehicles available in the United States with a correlation coefficient (R) of 0.108 and weighted average of 57.9%. Similarly, the statistical analysis conducted on geographies consisting of 186,595,631 people shows a weak positive correlation between the proportion of Immigrants from Nepal and percentage of households with 2 or more vehicles available in the United States with a correlation coefficient (R) of 0.230 and weighted average of 53.5%, a difference of 8.1%.
2 or more Vehicles in Household Correlation Summary
| Measurement | Shoshone | Immigrants from Nepal |
| Minimum | 48.5% | 23.8% |
| Maximum | 100.0% | 85.6% |
| Range | 51.5% | 61.8% |
| Mean | 72.3% | 56.7% |
| Median | 71.8% | 55.9% |
| Interquartile 25% (IQ1) | 65.4% | 51.2% |
| Interquartile 75% (IQ3) | 77.1% | 61.3% |
| Interquartile Range (IQR) | 11.7% | 10.1% |
| Standard Deviation (Sample) | 12.1% | 10.6% |
| Standard Deviation (Population) | 11.9% | 10.5% |
Similar Demographics by 2 or more Vehicles in Household
Demographics Similar to Shoshone by 2 or more Vehicles in Household
In terms of 2 or more vehicles in household, the demographic groups most similar to Shoshone are Ottawa (57.9%, a difference of 0.0%), Pakistani (57.9%, a difference of 0.020%), Immigrants from Germany (57.9%, a difference of 0.050%), Hispanic or Latino (57.9%, a difference of 0.050%), and Filipino (57.8%, a difference of 0.060%).
| Demographics | Rating | Rank | 2 or more Vehicles in Household |
| Slovaks | 99.2 /100 | #85 | Exceptional 58.0% |
| Potawatomi | 99.1 /100 | #86 | Exceptional 58.0% |
| Thais | 99.1 /100 | #87 | Exceptional 57.9% |
| Immigrants | Iran | 99.1 /100 | #88 | Exceptional 57.9% |
| Immigrants | Germany | 99.0 /100 | #89 | Exceptional 57.9% |
| Hispanics or Latinos | 99.0 /100 | #90 | Exceptional 57.9% |
| Pakistanis | 99.0 /100 | #91 | Exceptional 57.9% |
| Shoshone | 99.0 /100 | #92 | Exceptional 57.9% |
| Ottawa | 99.0 /100 | #93 | Exceptional 57.9% |
| Filipinos | 98.9 /100 | #94 | Exceptional 57.8% |
| Hmong | 98.9 /100 | #95 | Exceptional 57.8% |
| Burmese | 98.8 /100 | #96 | Exceptional 57.8% |
| Slavs | 98.8 /100 | #97 | Exceptional 57.8% |
| Palestinians | 98.6 /100 | #98 | Exceptional 57.7% |
| Cajuns | 98.5 /100 | #99 | Exceptional 57.7% |
Demographics Similar to Immigrants from Nepal by 2 or more Vehicles in Household
In terms of 2 or more vehicles in household, the demographic groups most similar to Immigrants from Nepal are Panamanian (53.5%, a difference of 0.050%), Immigrants from Turkey (53.6%, a difference of 0.060%), Alaska Native (53.6%, a difference of 0.080%), Immigrants from Guatemala (53.5%, a difference of 0.12%), and Ugandan (53.5%, a difference of 0.13%).
| Demographics | Rating | Rank | 2 or more Vehicles in Household |
| Immigrants | Bosnia and Herzegovina | 5.5 /100 | #223 | Tragic 53.8% |
| Brazilians | 5.3 /100 | #224 | Tragic 53.8% |
| Immigrants | Egypt | 5.2 /100 | #225 | Tragic 53.8% |
| Immigrants | Eastern Africa | 5.1 /100 | #226 | Tragic 53.7% |
| Sudanese | 4.1 /100 | #227 | Tragic 53.6% |
| Alaska Natives | 3.9 /100 | #228 | Tragic 53.6% |
| Immigrants | Turkey | 3.8 /100 | #229 | Tragic 53.6% |
| Immigrants | Nepal | 3.6 /100 | #230 | Tragic 53.5% |
| Panamanians | 3.4 /100 | #231 | Tragic 53.5% |
| Immigrants | Guatemala | 3.2 /100 | #232 | Tragic 53.5% |
| Ugandans | 3.2 /100 | #233 | Tragic 53.5% |
| Immigrants | Switzerland | 3.0 /100 | #234 | Tragic 53.4% |
| Immigrants | Middle Africa | 3.0 /100 | #235 | Tragic 53.4% |
| Indonesians | 2.7 /100 | #236 | Tragic 53.4% |
| Macedonians | 2.4 /100 | #237 | Tragic 53.3% |