Albanian vs Immigrants from Kuwait 2 or more Vehicles in Household
COMPARE
Albanian
Immigrants from Kuwait
2 or more Vehicles in Household
2 or more Vehicles in Household Comparison
Albanians
Immigrants from Kuwait
49.0%
2 OR MORE VEHICLES IN HOUSEHOLD
0.0/ 100
METRIC RATING
308th/ 347
METRIC RANK
55.8%
2 OR MORE VEHICLES IN HOUSEHOLD
70.2/ 100
METRIC RATING
157th/ 347
METRIC RANK
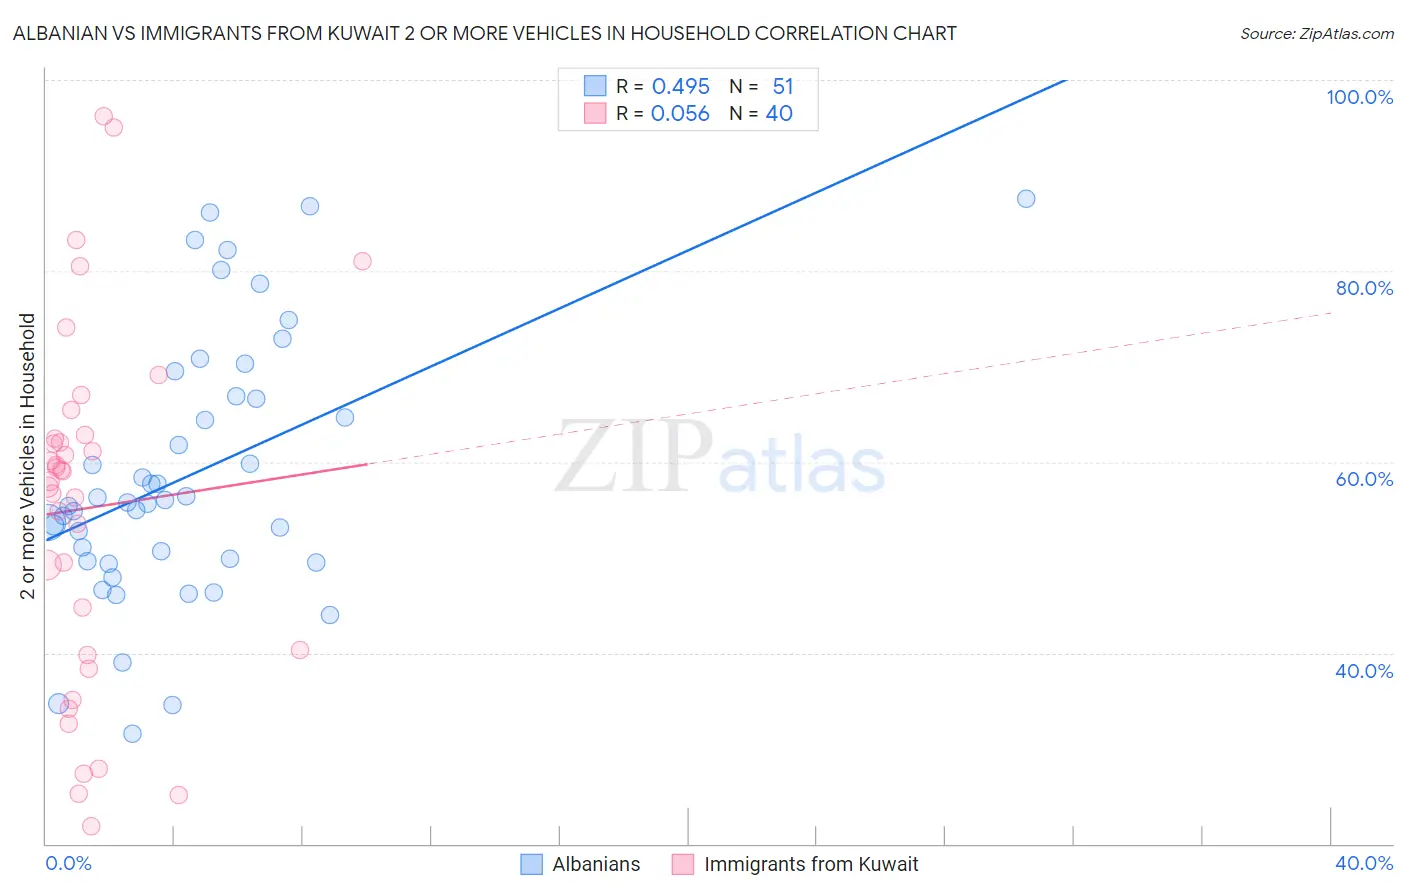
Albanian vs Immigrants from Kuwait 2 or more Vehicles in Household Correlation Chart
The statistical analysis conducted on geographies consisting of 193,189,951 people shows a moderate positive correlation between the proportion of Albanians and percentage of households with 2 or more vehicles available in the United States with a correlation coefficient (R) of 0.495 and weighted average of 49.0%. Similarly, the statistical analysis conducted on geographies consisting of 136,894,640 people shows a slight positive correlation between the proportion of Immigrants from Kuwait and percentage of households with 2 or more vehicles available in the United States with a correlation coefficient (R) of 0.056 and weighted average of 55.8%, a difference of 13.9%.
2 or more Vehicles in Household Correlation Summary
| Measurement | Albanian | Immigrants from Kuwait |
| Minimum | 31.6% | 21.8% |
| Maximum | 87.5% | 96.2% |
| Range | 55.9% | 74.4% |
| Mean | 58.6% | 55.2% |
| Median | 55.7% | 58.5% |
| Interquartile 25% (IQ1) | 49.6% | 40.0% |
| Interquartile 75% (IQ3) | 66.8% | 62.6% |
| Interquartile Range (IQR) | 17.2% | 22.7% |
| Standard Deviation (Sample) | 13.7% | 18.4% |
| Standard Deviation (Population) | 13.5% | 18.2% |
Similar Demographics by 2 or more Vehicles in Household
Demographics Similar to Albanians by 2 or more Vehicles in Household
In terms of 2 or more vehicles in household, the demographic groups most similar to Albanians are Hopi (49.0%, a difference of 0.070%), Moroccan (48.8%, a difference of 0.35%), Immigrants from Israel (49.2%, a difference of 0.50%), Immigrants from Western Africa (49.4%, a difference of 0.76%), and Immigrants from Belize (49.9%, a difference of 1.8%).
| Demographics | Rating | Rank | 2 or more Vehicles in Household |
| Immigrants | Greece | 0.0 /100 | #301 | Tragic 50.2% |
| Immigrants | South America | 0.0 /100 | #302 | Tragic 50.2% |
| Tohono O'odham | 0.0 /100 | #303 | Tragic 50.0% |
| Immigrants | Belize | 0.0 /100 | #304 | Tragic 49.9% |
| Immigrants | Western Africa | 0.0 /100 | #305 | Tragic 49.4% |
| Immigrants | Israel | 0.0 /100 | #306 | Tragic 49.2% |
| Hopi | 0.0 /100 | #307 | Tragic 49.0% |
| Albanians | 0.0 /100 | #308 | Tragic 49.0% |
| Moroccans | 0.0 /100 | #309 | Tragic 48.8% |
| Ghanaians | 0.0 /100 | #310 | Tragic 48.0% |
| Immigrants | Belarus | 0.0 /100 | #311 | Tragic 47.9% |
| Haitians | 0.0 /100 | #312 | Tragic 47.6% |
| U.S. Virgin Islanders | 0.0 /100 | #313 | Tragic 47.5% |
| Immigrants | Ghana | 0.0 /100 | #314 | Tragic 47.4% |
| Puerto Ricans | 0.0 /100 | #315 | Tragic 47.1% |
Demographics Similar to Immigrants from Kuwait by 2 or more Vehicles in Household
In terms of 2 or more vehicles in household, the demographic groups most similar to Immigrants from Kuwait are Immigrants from Lithuania (55.8%, a difference of 0.010%), Ukrainian (55.8%, a difference of 0.030%), Immigrants from Venezuela (55.8%, a difference of 0.030%), Lumbee (55.9%, a difference of 0.080%), and Tlingit-Haida (55.8%, a difference of 0.080%).
| Demographics | Rating | Rank | 2 or more Vehicles in Household |
| Nicaraguans | 79.9 /100 | #150 | Good 56.1% |
| Immigrants | Northern Europe | 78.7 /100 | #151 | Good 56.1% |
| Immigrants | Pakistan | 78.1 /100 | #152 | Good 56.1% |
| Lumbee | 71.9 /100 | #153 | Good 55.9% |
| Ukrainians | 70.8 /100 | #154 | Good 55.8% |
| Immigrants | Venezuela | 70.7 /100 | #155 | Good 55.8% |
| Immigrants | Lithuania | 70.4 /100 | #156 | Good 55.8% |
| Immigrants | Kuwait | 70.2 /100 | #157 | Good 55.8% |
| Tlingit-Haida | 68.5 /100 | #158 | Good 55.8% |
| Paiute | 68.0 /100 | #159 | Good 55.8% |
| Crow | 67.0 /100 | #160 | Good 55.7% |
| Colville | 61.1 /100 | #161 | Good 55.6% |
| German Russians | 60.9 /100 | #162 | Good 55.6% |
| Immigrants | Zimbabwe | 60.2 /100 | #163 | Good 55.6% |
| Dutch West Indians | 59.8 /100 | #164 | Average 55.6% |