Shoshone vs Delaware 2 or more Vehicles in Household
COMPARE
Shoshone
Delaware
2 or more Vehicles in Household
2 or more Vehicles in Household Comparison
Shoshone
Delaware
57.9%
2 OR MORE VEHICLES IN HOUSEHOLD
99.0/ 100
METRIC RATING
92nd/ 347
METRIC RANK
58.2%
2 OR MORE VEHICLES IN HOUSEHOLD
99.4/ 100
METRIC RATING
79th/ 347
METRIC RANK
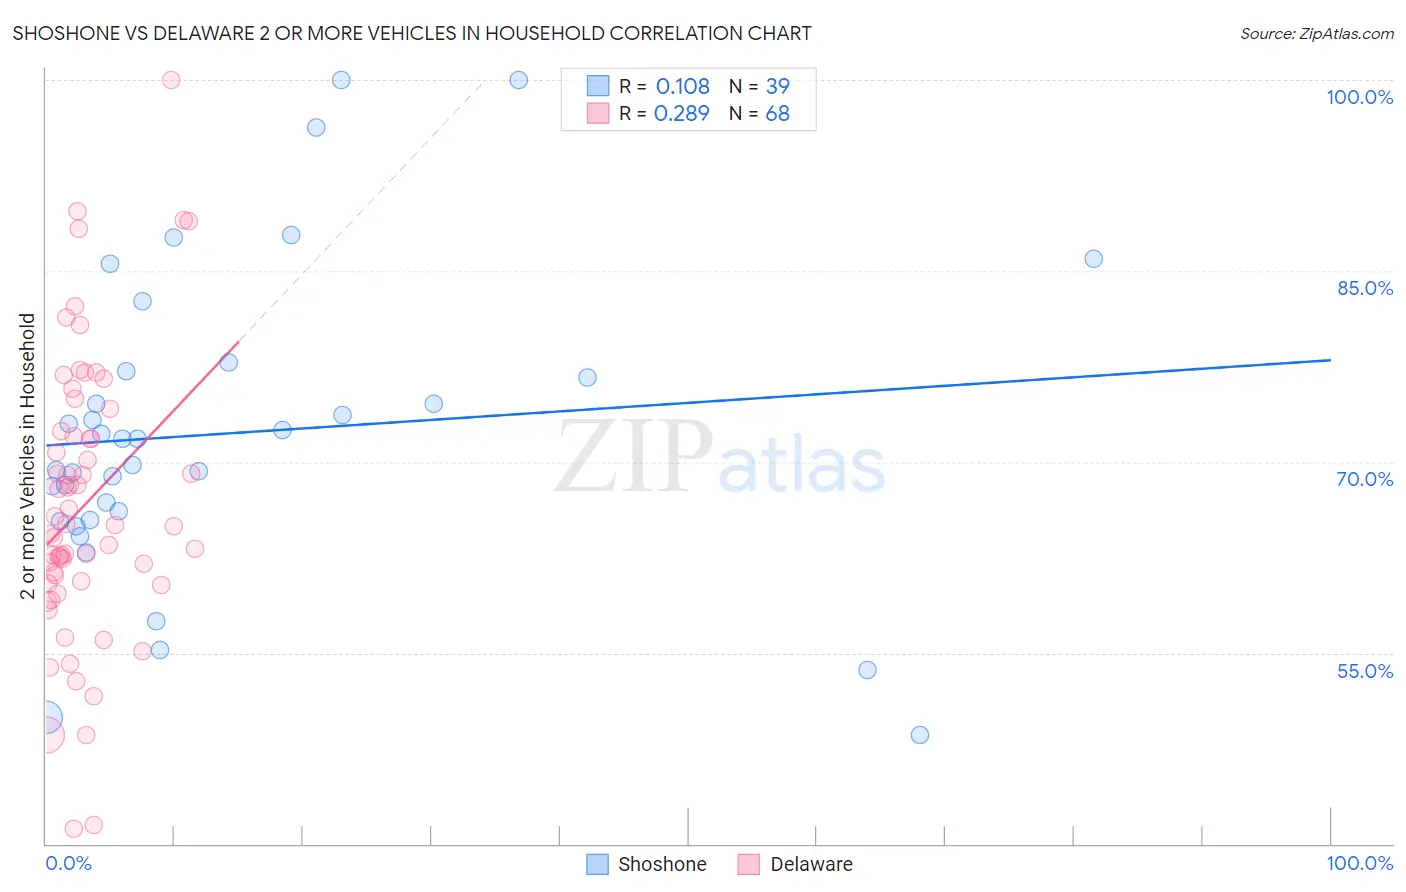
Shoshone vs Delaware 2 or more Vehicles in Household Correlation Chart
The statistical analysis conducted on geographies consisting of 66,615,877 people shows a poor positive correlation between the proportion of Shoshone and percentage of households with 2 or more vehicles available in the United States with a correlation coefficient (R) of 0.108 and weighted average of 57.9%. Similarly, the statistical analysis conducted on geographies consisting of 96,233,255 people shows a weak positive correlation between the proportion of Delaware and percentage of households with 2 or more vehicles available in the United States with a correlation coefficient (R) of 0.289 and weighted average of 58.2%, a difference of 0.56%.
2 or more Vehicles in Household Correlation Summary
| Measurement | Shoshone | Delaware |
| Minimum | 48.5% | 41.2% |
| Maximum | 100.0% | 100.0% |
| Range | 51.5% | 58.8% |
| Mean | 72.3% | 66.6% |
| Median | 71.8% | 65.0% |
| Interquartile 25% (IQ1) | 65.4% | 60.5% |
| Interquartile 75% (IQ3) | 77.1% | 72.2% |
| Interquartile Range (IQR) | 11.7% | 11.7% |
| Standard Deviation (Sample) | 12.1% | 11.1% |
| Standard Deviation (Population) | 11.9% | 11.1% |
Demographics Similar to Shoshone and Delaware by 2 or more Vehicles in Household
In terms of 2 or more vehicles in household, the demographic groups most similar to Shoshone are Ottawa (57.9%, a difference of 0.0%), Pakistani (57.9%, a difference of 0.020%), Immigrants from Germany (57.9%, a difference of 0.050%), Hispanic or Latino (57.9%, a difference of 0.050%), and Filipino (57.8%, a difference of 0.060%). Similarly, the demographic groups most similar to Delaware are Lithuanian (58.2%, a difference of 0.080%), Slovene (58.3%, a difference of 0.13%), Creek (58.3%, a difference of 0.14%), Immigrants from England (58.1%, a difference of 0.14%), and Immigrants from Iraq (58.1%, a difference of 0.16%).
| Demographics | Rating | Rank | 2 or more Vehicles in Household |
| Poles | 99.5 /100 | #75 | Exceptional 58.3% |
| Creek | 99.5 /100 | #76 | Exceptional 58.3% |
| Slovenes | 99.5 /100 | #77 | Exceptional 58.3% |
| Lithuanians | 99.5 /100 | #78 | Exceptional 58.2% |
| Delaware | 99.4 /100 | #79 | Exceptional 58.2% |
| Immigrants | England | 99.3 /100 | #80 | Exceptional 58.1% |
| Immigrants | Iraq | 99.3 /100 | #81 | Exceptional 58.1% |
| Iranians | 99.3 /100 | #82 | Exceptional 58.1% |
| Icelanders | 99.2 /100 | #83 | Exceptional 58.0% |
| Maltese | 99.2 /100 | #84 | Exceptional 58.0% |
| Slovaks | 99.2 /100 | #85 | Exceptional 58.0% |
| Potawatomi | 99.1 /100 | #86 | Exceptional 58.0% |
| Thais | 99.1 /100 | #87 | Exceptional 57.9% |
| Immigrants | Iran | 99.1 /100 | #88 | Exceptional 57.9% |
| Immigrants | Germany | 99.0 /100 | #89 | Exceptional 57.9% |
| Hispanics or Latinos | 99.0 /100 | #90 | Exceptional 57.9% |
| Pakistanis | 99.0 /100 | #91 | Exceptional 57.9% |
| Shoshone | 99.0 /100 | #92 | Exceptional 57.9% |
| Ottawa | 99.0 /100 | #93 | Exceptional 57.9% |
| Filipinos | 98.9 /100 | #94 | Exceptional 57.8% |
| Hmong | 98.9 /100 | #95 | Exceptional 57.8% |