Shoshone vs Bangladeshi 2 or more Vehicles in Household
COMPARE
Shoshone
Bangladeshi
2 or more Vehicles in Household
2 or more Vehicles in Household Comparison
Shoshone
Bangladeshis
57.9%
2 OR MORE VEHICLES IN HOUSEHOLD
99.0/ 100
METRIC RATING
92nd/ 347
METRIC RANK
58.4%
2 OR MORE VEHICLES IN HOUSEHOLD
99.6/ 100
METRIC RATING
71st/ 347
METRIC RANK
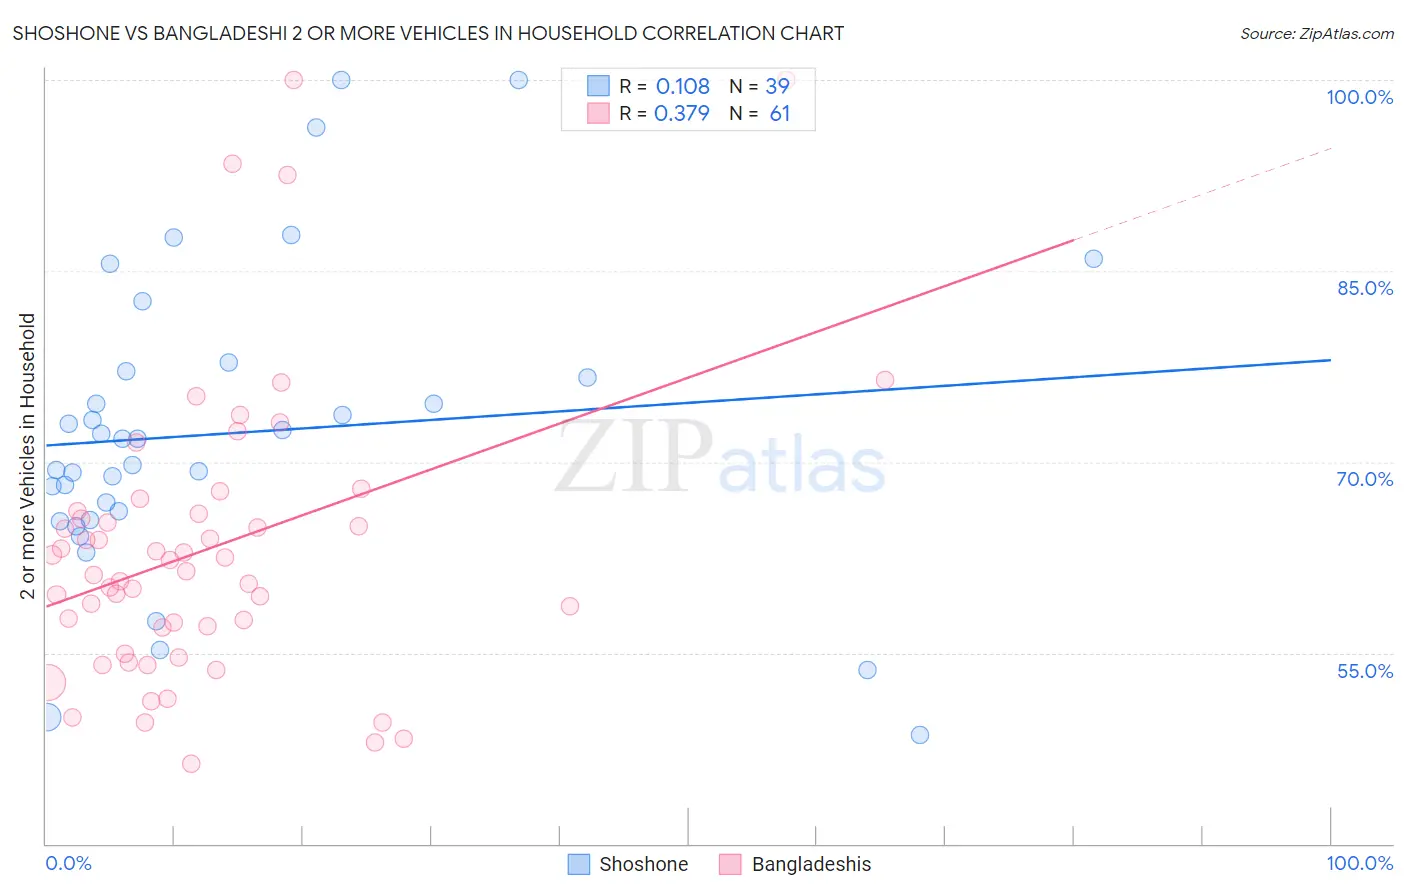
Shoshone vs Bangladeshi 2 or more Vehicles in Household Correlation Chart
The statistical analysis conducted on geographies consisting of 66,615,877 people shows a poor positive correlation between the proportion of Shoshone and percentage of households with 2 or more vehicles available in the United States with a correlation coefficient (R) of 0.108 and weighted average of 57.9%. Similarly, the statistical analysis conducted on geographies consisting of 141,360,423 people shows a mild positive correlation between the proportion of Bangladeshis and percentage of households with 2 or more vehicles available in the United States with a correlation coefficient (R) of 0.379 and weighted average of 58.4%, a difference of 0.97%.
2 or more Vehicles in Household Correlation Summary
| Measurement | Shoshone | Bangladeshi |
| Minimum | 48.5% | 46.3% |
| Maximum | 100.0% | 100.0% |
| Range | 51.5% | 53.7% |
| Mean | 72.3% | 63.1% |
| Median | 71.8% | 61.4% |
| Interquartile 25% (IQ1) | 65.4% | 56.0% |
| Interquartile 75% (IQ3) | 77.1% | 66.0% |
| Interquartile Range (IQR) | 11.7% | 10.0% |
| Standard Deviation (Sample) | 12.1% | 11.5% |
| Standard Deviation (Population) | 11.9% | 11.4% |
Similar Demographics by 2 or more Vehicles in Household
Demographics Similar to Shoshone by 2 or more Vehicles in Household
In terms of 2 or more vehicles in household, the demographic groups most similar to Shoshone are Ottawa (57.9%, a difference of 0.0%), Pakistani (57.9%, a difference of 0.020%), Immigrants from Germany (57.9%, a difference of 0.050%), Hispanic or Latino (57.9%, a difference of 0.050%), and Filipino (57.8%, a difference of 0.060%).
| Demographics | Rating | Rank | 2 or more Vehicles in Household |
| Slovaks | 99.2 /100 | #85 | Exceptional 58.0% |
| Potawatomi | 99.1 /100 | #86 | Exceptional 58.0% |
| Thais | 99.1 /100 | #87 | Exceptional 57.9% |
| Immigrants | Iran | 99.1 /100 | #88 | Exceptional 57.9% |
| Immigrants | Germany | 99.0 /100 | #89 | Exceptional 57.9% |
| Hispanics or Latinos | 99.0 /100 | #90 | Exceptional 57.9% |
| Pakistanis | 99.0 /100 | #91 | Exceptional 57.9% |
| Shoshone | 99.0 /100 | #92 | Exceptional 57.9% |
| Ottawa | 99.0 /100 | #93 | Exceptional 57.9% |
| Filipinos | 98.9 /100 | #94 | Exceptional 57.8% |
| Hmong | 98.9 /100 | #95 | Exceptional 57.8% |
| Burmese | 98.8 /100 | #96 | Exceptional 57.8% |
| Slavs | 98.8 /100 | #97 | Exceptional 57.8% |
| Palestinians | 98.6 /100 | #98 | Exceptional 57.7% |
| Cajuns | 98.5 /100 | #99 | Exceptional 57.7% |
Demographics Similar to Bangladeshis by 2 or more Vehicles in Household
In terms of 2 or more vehicles in household, the demographic groups most similar to Bangladeshis are Italian (58.4%, a difference of 0.020%), Austrian (58.4%, a difference of 0.030%), Pennsylvania German (58.5%, a difference of 0.14%), Bolivian (58.3%, a difference of 0.15%), and Immigrants from Afghanistan (58.3%, a difference of 0.16%).
| Demographics | Rating | Rank | 2 or more Vehicles in Household |
| Portuguese | 99.7 /100 | #64 | Exceptional 58.6% |
| Immigrants | Central America | 99.7 /100 | #65 | Exceptional 58.6% |
| Croatians | 99.7 /100 | #66 | Exceptional 58.6% |
| Laotians | 99.7 /100 | #67 | Exceptional 58.6% |
| Canadians | 99.7 /100 | #68 | Exceptional 58.6% |
| Pennsylvania Germans | 99.7 /100 | #69 | Exceptional 58.5% |
| Italians | 99.6 /100 | #70 | Exceptional 58.4% |
| Bangladeshis | 99.6 /100 | #71 | Exceptional 58.4% |
| Austrians | 99.6 /100 | #72 | Exceptional 58.4% |
| Bolivians | 99.6 /100 | #73 | Exceptional 58.3% |
| Immigrants | Afghanistan | 99.6 /100 | #74 | Exceptional 58.3% |
| Poles | 99.5 /100 | #75 | Exceptional 58.3% |
| Creek | 99.5 /100 | #76 | Exceptional 58.3% |
| Slovenes | 99.5 /100 | #77 | Exceptional 58.3% |
| Lithuanians | 99.5 /100 | #78 | Exceptional 58.2% |