Seminole vs Immigrants from Israel Single Male Poverty
COMPARE
Seminole
Immigrants from Israel
Single Male Poverty
Single Male Poverty Comparison
Seminole
Immigrants from Israel
16.0%
SINGLE MALE POVERTY
0.0/ 100
METRIC RATING
311th/ 347
METRIC RANK
12.1%
SINGLE MALE POVERTY
98.5/ 100
METRIC RATING
86th/ 347
METRIC RANK
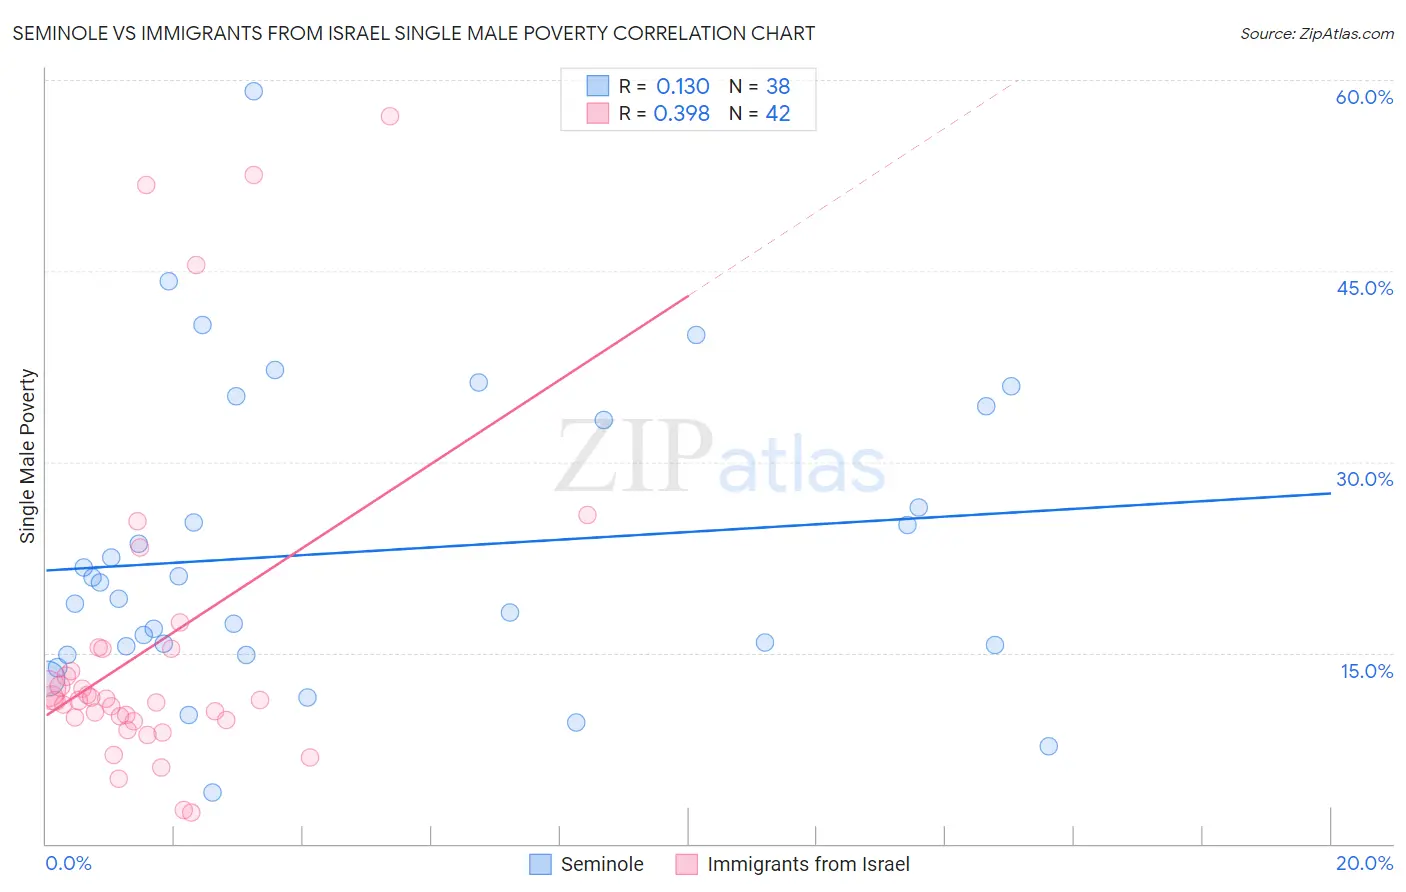
Seminole vs Immigrants from Israel Single Male Poverty Correlation Chart
The statistical analysis conducted on geographies consisting of 113,333,266 people shows a poor positive correlation between the proportion of Seminole and poverty level among single males in the United States with a correlation coefficient (R) of 0.130 and weighted average of 16.0%. Similarly, the statistical analysis conducted on geographies consisting of 190,801,903 people shows a mild positive correlation between the proportion of Immigrants from Israel and poverty level among single males in the United States with a correlation coefficient (R) of 0.398 and weighted average of 12.1%, a difference of 32.4%.
Single Male Poverty Correlation Summary
| Measurement | Seminole | Immigrants from Israel |
| Minimum | 4.0% | 2.4% |
| Maximum | 59.1% | 57.1% |
| Range | 55.1% | 54.7% |
| Mean | 22.9% | 15.4% |
| Median | 19.9% | 11.3% |
| Interquartile 25% (IQ1) | 15.5% | 9.7% |
| Interquartile 75% (IQ3) | 33.3% | 15.3% |
| Interquartile Range (IQR) | 17.9% | 5.6% |
| Standard Deviation (Sample) | 11.7% | 12.9% |
| Standard Deviation (Population) | 11.6% | 12.8% |
Similar Demographics by Single Male Poverty
Demographics Similar to Seminole by Single Male Poverty
In terms of single male poverty, the demographic groups most similar to Seminole are Comanche (16.0%, a difference of 0.0%), Cherokee (16.1%, a difference of 0.23%), Alaskan Athabascan (16.1%, a difference of 0.52%), Yakama (15.9%, a difference of 0.54%), and Cheyenne (16.1%, a difference of 0.57%).
| Demographics | Rating | Rank | Single Male Poverty |
| Alaska Natives | 0.0 /100 | #304 | Tragic 15.4% |
| Blackfeet | 0.0 /100 | #305 | Tragic 15.5% |
| Pennsylvania Germans | 0.0 /100 | #306 | Tragic 15.6% |
| Ute | 0.0 /100 | #307 | Tragic 15.7% |
| Potawatomi | 0.0 /100 | #308 | Tragic 15.8% |
| Americans | 0.0 /100 | #309 | Tragic 15.8% |
| Yakama | 0.0 /100 | #310 | Tragic 15.9% |
| Seminole | 0.0 /100 | #311 | Tragic 16.0% |
| Comanche | 0.0 /100 | #312 | Tragic 16.0% |
| Cherokee | 0.0 /100 | #313 | Tragic 16.1% |
| Alaskan Athabascans | 0.0 /100 | #314 | Tragic 16.1% |
| Cheyenne | 0.0 /100 | #315 | Tragic 16.1% |
| Dutch West Indians | 0.0 /100 | #316 | Tragic 16.1% |
| Blacks/African Americans | 0.0 /100 | #317 | Tragic 16.2% |
| Chickasaw | 0.0 /100 | #318 | Tragic 16.3% |
Demographics Similar to Immigrants from Israel by Single Male Poverty
In terms of single male poverty, the demographic groups most similar to Immigrants from Israel are South American (12.1%, a difference of 0.010%), Turkish (12.1%, a difference of 0.020%), Immigrants from Eritrea (12.1%, a difference of 0.020%), Immigrants from Czechoslovakia (12.1%, a difference of 0.090%), and Immigrants from Colombia (12.1%, a difference of 0.12%).
| Demographics | Rating | Rank | Single Male Poverty |
| Immigrants | Belgium | 99.0 /100 | #79 | Exceptional 12.0% |
| Armenians | 98.7 /100 | #80 | Exceptional 12.1% |
| Immigrants | South America | 98.7 /100 | #81 | Exceptional 12.1% |
| Immigrants | Colombia | 98.6 /100 | #82 | Exceptional 12.1% |
| Immigrants | Chile | 98.6 /100 | #83 | Exceptional 12.1% |
| Immigrants | Czechoslovakia | 98.6 /100 | #84 | Exceptional 12.1% |
| Turks | 98.5 /100 | #85 | Exceptional 12.1% |
| Immigrants | Israel | 98.5 /100 | #86 | Exceptional 12.1% |
| South Americans | 98.5 /100 | #87 | Exceptional 12.1% |
| Immigrants | Eritrea | 98.5 /100 | #88 | Exceptional 12.1% |
| Immigrants | Ireland | 98.3 /100 | #89 | Exceptional 12.1% |
| South American Indians | 98.3 /100 | #90 | Exceptional 12.1% |
| Immigrants | Turkey | 98.2 /100 | #91 | Exceptional 12.1% |
| Spanish American Indians | 98.0 /100 | #92 | Exceptional 12.1% |
| Immigrants | Bosnia and Herzegovina | 97.9 /100 | #93 | Exceptional 12.1% |