Scotch-Irish vs Chilean No Vehicles in Household
COMPARE
Scotch-Irish
Chilean
No Vehicles in Household
No Vehicles in Household Comparison
Scotch-Irish
Chileans
6.8%
NO VEHICLES IN HOUSEHOLD
100.0/ 100
METRIC RATING
9th/ 347
METRIC RANK
9.9%
NO VEHICLES IN HOUSEHOLD
81.2/ 100
METRIC RATING
143rd/ 347
METRIC RANK
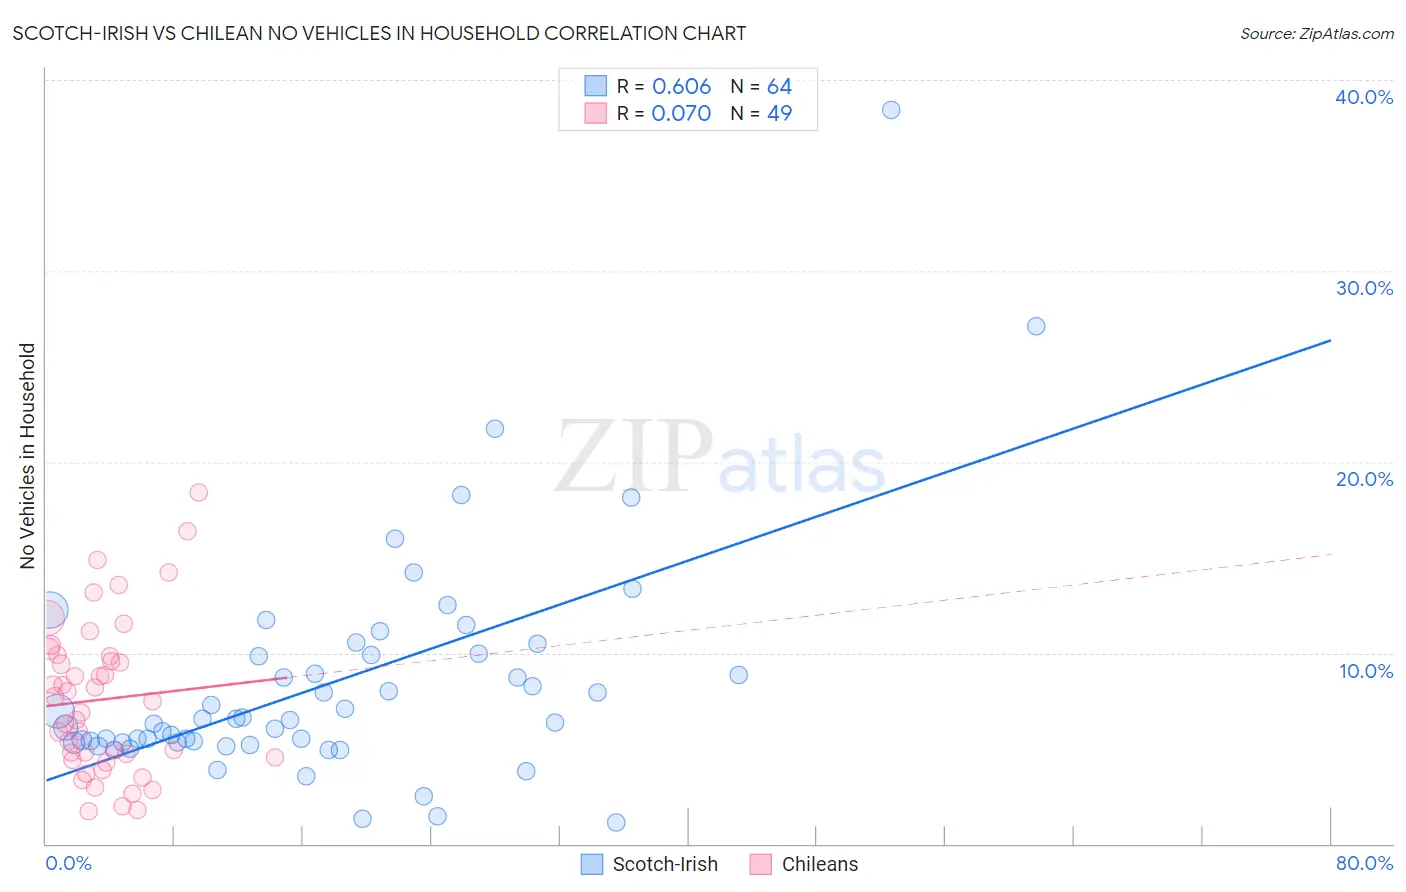
Scotch-Irish vs Chilean No Vehicles in Household Correlation Chart
The statistical analysis conducted on geographies consisting of 544,331,951 people shows a significant positive correlation between the proportion of Scotch-Irish and percentage of households with no vehicle available in the United States with a correlation coefficient (R) of 0.606 and weighted average of 6.8%. Similarly, the statistical analysis conducted on geographies consisting of 256,325,892 people shows a slight positive correlation between the proportion of Chileans and percentage of households with no vehicle available in the United States with a correlation coefficient (R) of 0.070 and weighted average of 9.9%, a difference of 45.3%.
No Vehicles in Household Correlation Summary
| Measurement | Scotch-Irish | Chilean |
| Minimum | 1.1% | 1.7% |
| Maximum | 38.5% | 18.4% |
| Range | 37.4% | 16.7% |
| Mean | 8.4% | 7.6% |
| Median | 6.5% | 7.5% |
| Interquartile 25% (IQ1) | 5.3% | 4.4% |
| Interquartile 75% (IQ3) | 9.9% | 9.9% |
| Interquartile Range (IQR) | 4.6% | 5.4% |
| Standard Deviation (Sample) | 6.0% | 4.0% |
| Standard Deviation (Population) | 6.0% | 3.9% |
Similar Demographics by No Vehicles in Household
Demographics Similar to Scotch-Irish by No Vehicles in Household
In terms of no vehicles in household, the demographic groups most similar to Scotch-Irish are Swedish (6.8%, a difference of 0.21%), Dutch (6.8%, a difference of 0.51%), Scottish (6.8%, a difference of 0.68%), Czech (6.9%, a difference of 1.1%), and German (6.7%, a difference of 2.0%).
| Demographics | Rating | Rank | No Vehicles in Household |
| Norwegians | 100.0 /100 | #2 | Exceptional 6.4% |
| English | 100.0 /100 | #3 | Exceptional 6.5% |
| Danes | 100.0 /100 | #4 | Exceptional 6.6% |
| Yakama | 100.0 /100 | #5 | Exceptional 6.6% |
| Germans | 100.0 /100 | #6 | Exceptional 6.7% |
| Scottish | 100.0 /100 | #7 | Exceptional 6.8% |
| Swedes | 100.0 /100 | #8 | Exceptional 6.8% |
| Scotch-Irish | 100.0 /100 | #9 | Exceptional 6.8% |
| Dutch | 100.0 /100 | #10 | Exceptional 6.8% |
| Czechs | 100.0 /100 | #11 | Exceptional 6.9% |
| Assyrians/Chaldeans/Syriacs | 100.0 /100 | #12 | Exceptional 7.0% |
| Scandinavians | 100.0 /100 | #13 | Exceptional 7.0% |
| Mexicans | 100.0 /100 | #14 | Exceptional 7.0% |
| Whites/Caucasians | 100.0 /100 | #15 | Exceptional 7.0% |
| Europeans | 100.0 /100 | #16 | Exceptional 7.1% |
Demographics Similar to Chileans by No Vehicles in Household
In terms of no vehicles in household, the demographic groups most similar to Chileans are Immigrants from Bahamas (9.9%, a difference of 0.0%), Bahamian (9.9%, a difference of 0.030%), Hungarian (9.9%, a difference of 0.26%), Immigrants from Nicaragua (9.9%, a difference of 0.31%), and Immigrants from Zimbabwe (9.9%, a difference of 0.35%).
| Demographics | Rating | Rank | No Vehicles in Household |
| Immigrants | South Africa | 85.0 /100 | #136 | Excellent 9.8% |
| Immigrants | Moldova | 84.6 /100 | #137 | Excellent 9.8% |
| Estonians | 84.2 /100 | #138 | Excellent 9.8% |
| Marshallese | 84.0 /100 | #139 | Excellent 9.8% |
| Immigrants | Lithuania | 84.0 /100 | #140 | Excellent 9.8% |
| Sudanese | 83.1 /100 | #141 | Excellent 9.8% |
| Immigrants | Zimbabwe | 82.6 /100 | #142 | Excellent 9.9% |
| Chileans | 81.2 /100 | #143 | Excellent 9.9% |
| Immigrants | Bahamas | 81.2 /100 | #144 | Excellent 9.9% |
| Bahamians | 81.0 /100 | #145 | Excellent 9.9% |
| Hungarians | 80.0 /100 | #146 | Excellent 9.9% |
| Immigrants | Nicaragua | 79.8 /100 | #147 | Good 9.9% |
| Immigrants | Bosnia and Herzegovina | 79.1 /100 | #148 | Good 9.9% |
| Immigrants | Uganda | 76.1 /100 | #149 | Good 10.0% |
| Colombians | 73.9 /100 | #150 | Good 10.0% |