Scotch-Irish vs Ecuadorian No Vehicles in Household
COMPARE
Scotch-Irish
Ecuadorian
No Vehicles in Household
No Vehicles in Household Comparison
Scotch-Irish
Ecuadorians
6.8%
NO VEHICLES IN HOUSEHOLD
100.0/ 100
METRIC RATING
9th/ 347
METRIC RANK
22.8%
NO VEHICLES IN HOUSEHOLD
0.0/ 100
METRIC RATING
329th/ 347
METRIC RANK
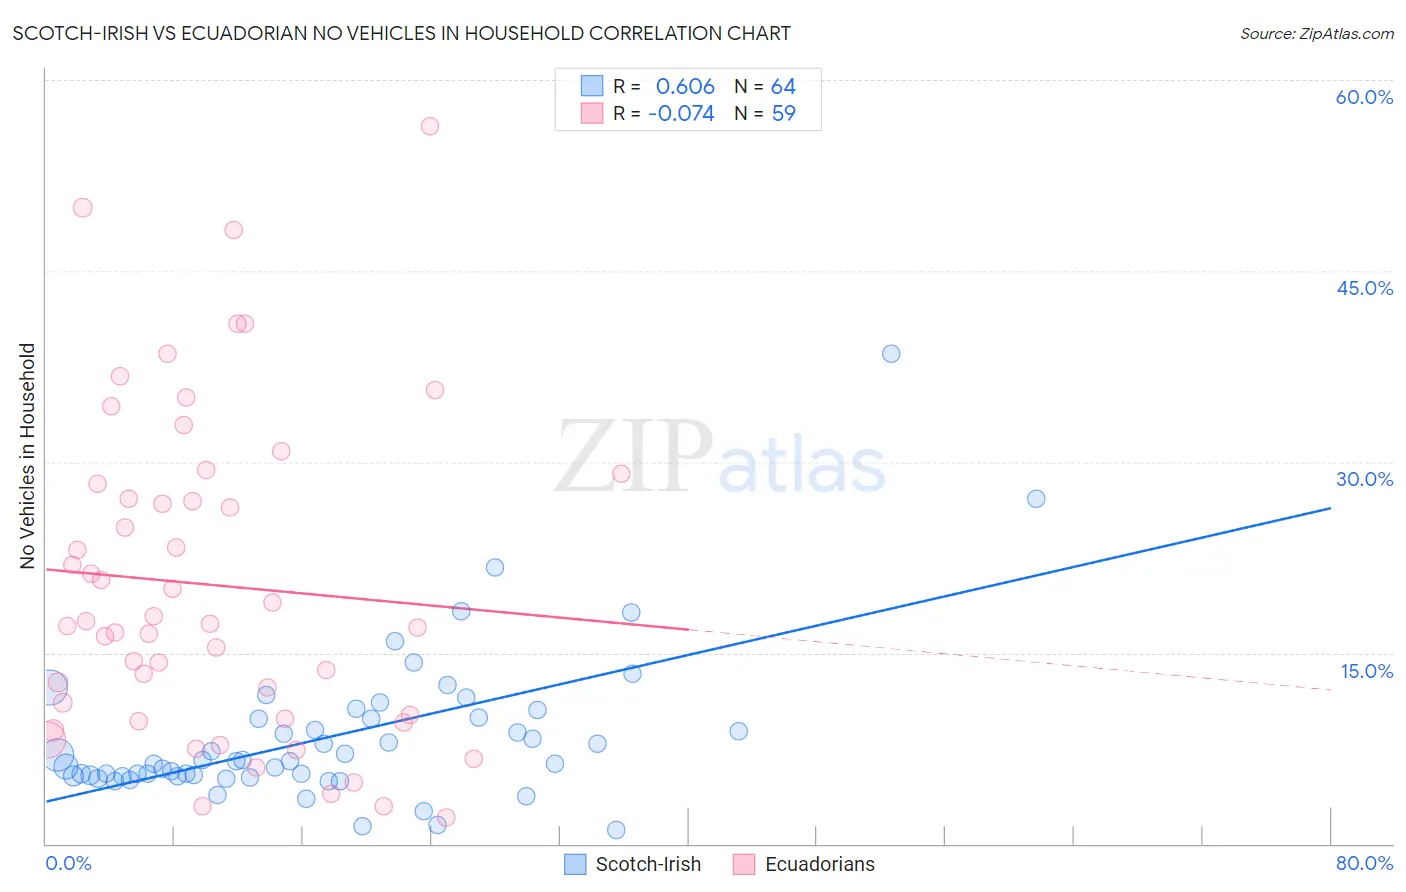
Scotch-Irish vs Ecuadorian No Vehicles in Household Correlation Chart
The statistical analysis conducted on geographies consisting of 544,331,951 people shows a significant positive correlation between the proportion of Scotch-Irish and percentage of households with no vehicle available in the United States with a correlation coefficient (R) of 0.606 and weighted average of 6.8%. Similarly, the statistical analysis conducted on geographies consisting of 317,233,310 people shows a slight negative correlation between the proportion of Ecuadorians and percentage of households with no vehicle available in the United States with a correlation coefficient (R) of -0.074 and weighted average of 22.8%, a difference of 234.1%.
No Vehicles in Household Correlation Summary
| Measurement | Scotch-Irish | Ecuadorian |
| Minimum | 1.1% | 2.1% |
| Maximum | 38.5% | 56.4% |
| Range | 37.4% | 54.3% |
| Mean | 8.4% | 20.3% |
| Median | 6.5% | 17.3% |
| Interquartile 25% (IQ1) | 5.3% | 9.8% |
| Interquartile 75% (IQ3) | 9.9% | 28.3% |
| Interquartile Range (IQR) | 4.6% | 18.5% |
| Standard Deviation (Sample) | 6.0% | 12.7% |
| Standard Deviation (Population) | 6.0% | 12.5% |
Similar Demographics by No Vehicles in Household
Demographics Similar to Scotch-Irish by No Vehicles in Household
In terms of no vehicles in household, the demographic groups most similar to Scotch-Irish are Swedish (6.8%, a difference of 0.21%), Dutch (6.8%, a difference of 0.51%), Scottish (6.8%, a difference of 0.68%), Czech (6.9%, a difference of 1.1%), and German (6.7%, a difference of 2.0%).
| Demographics | Rating | Rank | No Vehicles in Household |
| Norwegians | 100.0 /100 | #2 | Exceptional 6.4% |
| English | 100.0 /100 | #3 | Exceptional 6.5% |
| Danes | 100.0 /100 | #4 | Exceptional 6.6% |
| Yakama | 100.0 /100 | #5 | Exceptional 6.6% |
| Germans | 100.0 /100 | #6 | Exceptional 6.7% |
| Scottish | 100.0 /100 | #7 | Exceptional 6.8% |
| Swedes | 100.0 /100 | #8 | Exceptional 6.8% |
| Scotch-Irish | 100.0 /100 | #9 | Exceptional 6.8% |
| Dutch | 100.0 /100 | #10 | Exceptional 6.8% |
| Czechs | 100.0 /100 | #11 | Exceptional 6.9% |
| Assyrians/Chaldeans/Syriacs | 100.0 /100 | #12 | Exceptional 7.0% |
| Scandinavians | 100.0 /100 | #13 | Exceptional 7.0% |
| Mexicans | 100.0 /100 | #14 | Exceptional 7.0% |
| Whites/Caucasians | 100.0 /100 | #15 | Exceptional 7.0% |
| Europeans | 100.0 /100 | #16 | Exceptional 7.1% |
Demographics Similar to Ecuadorians by No Vehicles in Household
In terms of no vehicles in household, the demographic groups most similar to Ecuadorians are Immigrants from Dominica (22.2%, a difference of 2.3%), West Indian (23.7%, a difference of 4.2%), Trinidadian and Tobagonian (23.7%, a difference of 4.4%), Immigrants from Ecuador (23.8%, a difference of 4.7%), and Immigrants from Senegal (21.1%, a difference of 7.6%).
| Demographics | Rating | Rank | No Vehicles in Household |
| Immigrants | Cabo Verde | 0.0 /100 | #322 | Tragic 18.4% |
| Immigrants | Yemen | 0.0 /100 | #323 | Tragic 19.5% |
| Immigrants | Caribbean | 0.0 /100 | #324 | Tragic 19.6% |
| Senegalese | 0.0 /100 | #325 | Tragic 19.8% |
| Immigrants | West Indies | 0.0 /100 | #326 | Tragic 20.5% |
| Immigrants | Senegal | 0.0 /100 | #327 | Tragic 21.1% |
| Immigrants | Dominica | 0.0 /100 | #328 | Tragic 22.2% |
| Ecuadorians | 0.0 /100 | #329 | Tragic 22.8% |
| West Indians | 0.0 /100 | #330 | Tragic 23.7% |
| Trinidadians and Tobagonians | 0.0 /100 | #331 | Tragic 23.7% |
| Immigrants | Ecuador | 0.0 /100 | #332 | Tragic 23.8% |
| Immigrants | Trinidad and Tobago | 0.0 /100 | #333 | Tragic 24.6% |
| Immigrants | Bangladesh | 0.0 /100 | #334 | Tragic 25.8% |
| Barbadians | 0.0 /100 | #335 | Tragic 26.1% |
| Vietnamese | 0.0 /100 | #336 | Tragic 26.2% |