Scotch-Irish vs Chilean Cognitive Disability
COMPARE
Scotch-Irish
Chilean
Cognitive Disability
Cognitive Disability Comparison
Scotch-Irish
Chileans
17.1%
COGNITIVE DISABILITY
85.9/ 100
METRIC RATING
147th/ 347
METRIC RANK
17.0%
COGNITIVE DISABILITY
89.9/ 100
METRIC RATING
140th/ 347
METRIC RANK
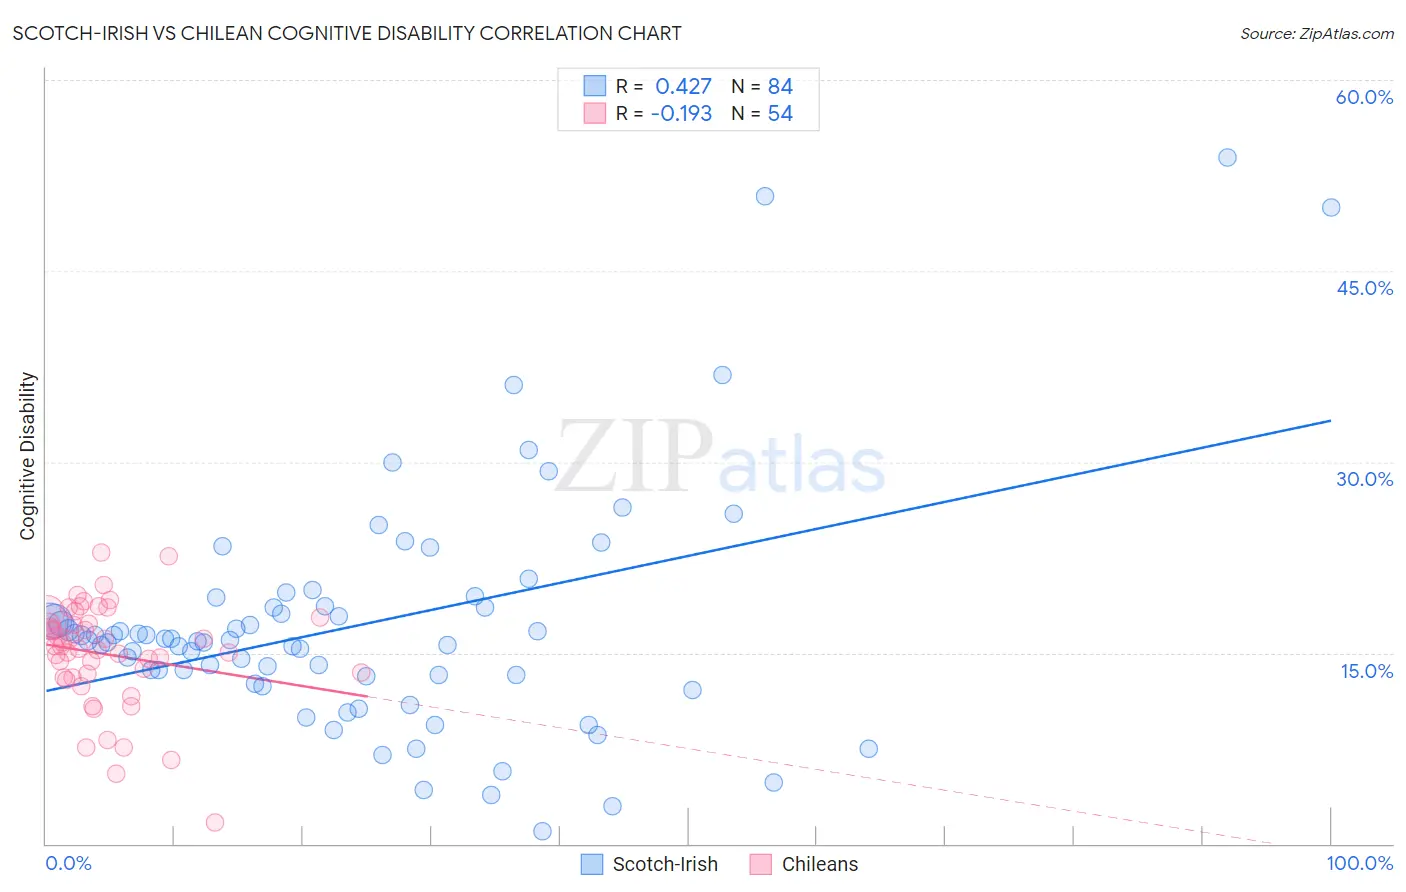
Scotch-Irish vs Chilean Cognitive Disability Correlation Chart
The statistical analysis conducted on geographies consisting of 548,652,939 people shows a moderate positive correlation between the proportion of Scotch-Irish and percentage of population with cognitive disability in the United States with a correlation coefficient (R) of 0.427 and weighted average of 17.1%. Similarly, the statistical analysis conducted on geographies consisting of 256,654,353 people shows a poor negative correlation between the proportion of Chileans and percentage of population with cognitive disability in the United States with a correlation coefficient (R) of -0.193 and weighted average of 17.0%, a difference of 0.28%.
Cognitive Disability Correlation Summary
| Measurement | Scotch-Irish | Chilean |
| Minimum | 0.99% | 1.6% |
| Maximum | 53.9% | 22.9% |
| Range | 52.9% | 21.3% |
| Mean | 17.2% | 14.9% |
| Median | 16.0% | 15.4% |
| Interquartile 25% (IQ1) | 13.2% | 13.1% |
| Interquartile 75% (IQ3) | 18.6% | 17.3% |
| Interquartile Range (IQR) | 5.4% | 4.2% |
| Standard Deviation (Sample) | 9.4% | 4.1% |
| Standard Deviation (Population) | 9.3% | 4.1% |
Demographics Similar to Scotch-Irish and Chileans by Cognitive Disability
In terms of cognitive disability, the demographic groups most similar to Scotch-Irish are French Canadian (17.1%, a difference of 0.010%), Cypriot (17.1%, a difference of 0.010%), Basque (17.1%, a difference of 0.030%), Costa Rican (17.0%, a difference of 0.13%), and Syrian (17.1%, a difference of 0.16%). Similarly, the demographic groups most similar to Chileans are French (17.0%, a difference of 0.0%), Aleut (17.0%, a difference of 0.0%), Carpatho Rusyn (17.0%, a difference of 0.030%), British (17.0%, a difference of 0.050%), and Immigrants from Brazil (17.0%, a difference of 0.050%).
| Demographics | Rating | Rank | Cognitive Disability |
| Immigrants | Jordan | 91.9 /100 | #133 | Exceptional 17.0% |
| Immigrants | Chile | 91.7 /100 | #134 | Exceptional 17.0% |
| Lebanese | 91.3 /100 | #135 | Exceptional 17.0% |
| Israelis | 91.0 /100 | #136 | Exceptional 17.0% |
| Immigrants | Norway | 90.9 /100 | #137 | Exceptional 17.0% |
| Welsh | 90.8 /100 | #138 | Exceptional 17.0% |
| French | 90.0 /100 | #139 | Excellent 17.0% |
| Chileans | 89.9 /100 | #140 | Excellent 17.0% |
| Aleuts | 89.9 /100 | #141 | Excellent 17.0% |
| Carpatho Rusyns | 89.6 /100 | #142 | Excellent 17.0% |
| British | 89.3 /100 | #143 | Excellent 17.0% |
| Immigrants | Brazil | 89.3 /100 | #144 | Excellent 17.0% |
| Immigrants | South Eastern Asia | 88.7 /100 | #145 | Excellent 17.0% |
| Costa Ricans | 88.0 /100 | #146 | Excellent 17.0% |
| Scotch-Irish | 85.9 /100 | #147 | Excellent 17.1% |
| French Canadians | 85.7 /100 | #148 | Excellent 17.1% |
| Cypriots | 85.7 /100 | #149 | Excellent 17.1% |
| Basques | 85.5 /100 | #150 | Excellent 17.1% |
| Syrians | 83.0 /100 | #151 | Excellent 17.1% |
| Immigrants | Indonesia | 82.7 /100 | #152 | Excellent 17.1% |
| Immigrants | Kazakhstan | 80.5 /100 | #153 | Excellent 17.1% |