Scotch-Irish vs Cree No Vehicles in Household
COMPARE
Scotch-Irish
Cree
No Vehicles in Household
No Vehicles in Household Comparison
Scotch-Irish
Cree
6.8%
NO VEHICLES IN HOUSEHOLD
100.0/ 100
METRIC RATING
9th/ 347
METRIC RANK
11.6%
NO VEHICLES IN HOUSEHOLD
3.5/ 100
METRIC RATING
236th/ 347
METRIC RANK
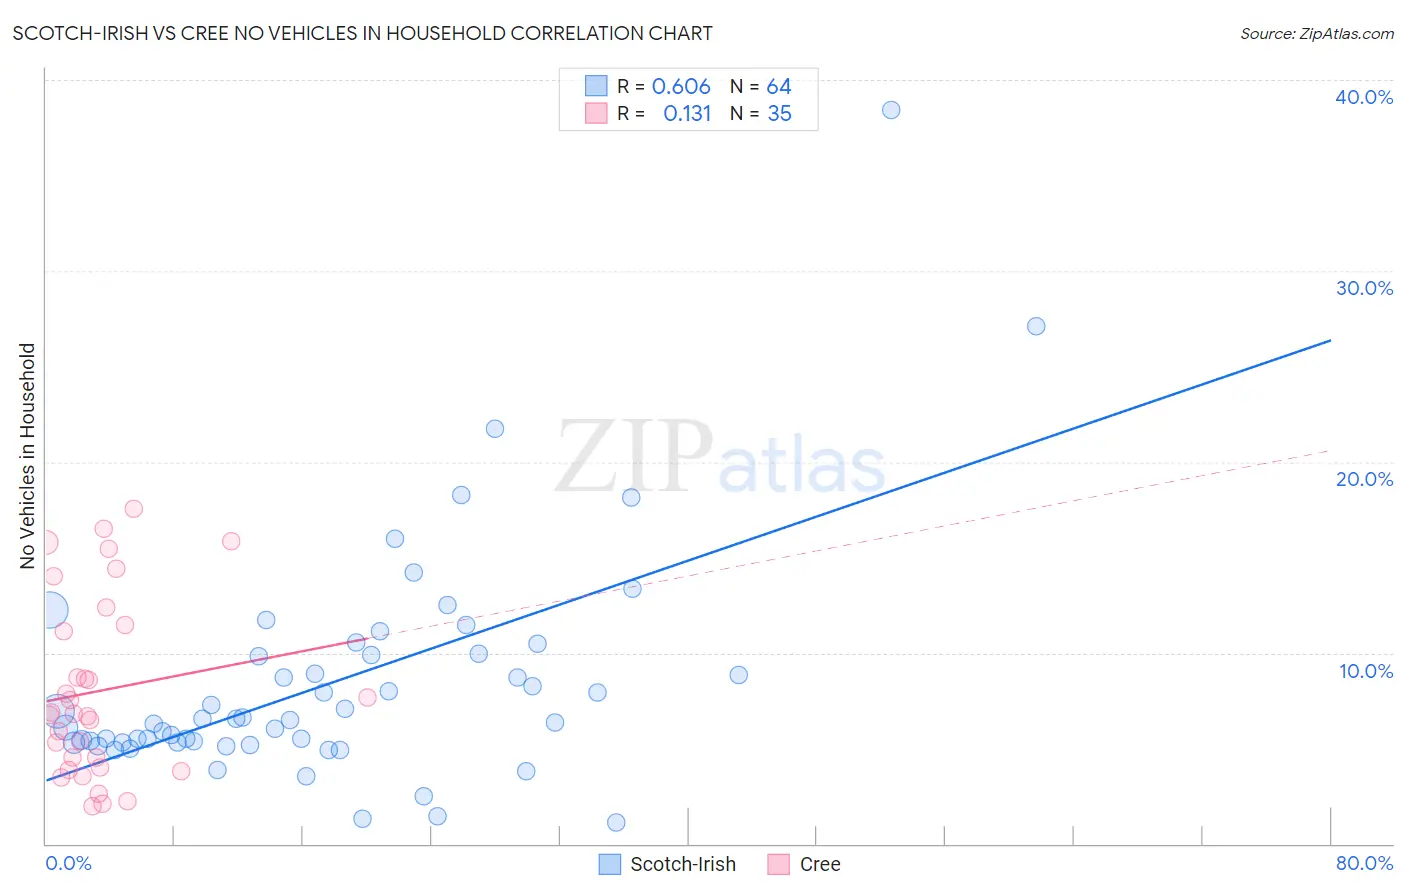
Scotch-Irish vs Cree No Vehicles in Household Correlation Chart
The statistical analysis conducted on geographies consisting of 544,331,951 people shows a significant positive correlation between the proportion of Scotch-Irish and percentage of households with no vehicle available in the United States with a correlation coefficient (R) of 0.606 and weighted average of 6.8%. Similarly, the statistical analysis conducted on geographies consisting of 76,143,133 people shows a poor positive correlation between the proportion of Cree and percentage of households with no vehicle available in the United States with a correlation coefficient (R) of 0.131 and weighted average of 11.6%, a difference of 69.9%.
No Vehicles in Household Correlation Summary
| Measurement | Scotch-Irish | Cree |
| Minimum | 1.1% | 2.0% |
| Maximum | 38.5% | 17.5% |
| Range | 37.4% | 15.6% |
| Mean | 8.4% | 8.0% |
| Median | 6.5% | 6.8% |
| Interquartile 25% (IQ1) | 5.3% | 4.0% |
| Interquartile 75% (IQ3) | 9.9% | 11.5% |
| Interquartile Range (IQR) | 4.6% | 7.4% |
| Standard Deviation (Sample) | 6.0% | 4.7% |
| Standard Deviation (Population) | 6.0% | 4.6% |
Similar Demographics by No Vehicles in Household
Demographics Similar to Scotch-Irish by No Vehicles in Household
In terms of no vehicles in household, the demographic groups most similar to Scotch-Irish are Swedish (6.8%, a difference of 0.21%), Dutch (6.8%, a difference of 0.51%), Scottish (6.8%, a difference of 0.68%), Czech (6.9%, a difference of 1.1%), and German (6.7%, a difference of 2.0%).
| Demographics | Rating | Rank | No Vehicles in Household |
| Norwegians | 100.0 /100 | #2 | Exceptional 6.4% |
| English | 100.0 /100 | #3 | Exceptional 6.5% |
| Danes | 100.0 /100 | #4 | Exceptional 6.6% |
| Yakama | 100.0 /100 | #5 | Exceptional 6.6% |
| Germans | 100.0 /100 | #6 | Exceptional 6.7% |
| Scottish | 100.0 /100 | #7 | Exceptional 6.8% |
| Swedes | 100.0 /100 | #8 | Exceptional 6.8% |
| Scotch-Irish | 100.0 /100 | #9 | Exceptional 6.8% |
| Dutch | 100.0 /100 | #10 | Exceptional 6.8% |
| Czechs | 100.0 /100 | #11 | Exceptional 6.9% |
| Assyrians/Chaldeans/Syriacs | 100.0 /100 | #12 | Exceptional 7.0% |
| Scandinavians | 100.0 /100 | #13 | Exceptional 7.0% |
| Mexicans | 100.0 /100 | #14 | Exceptional 7.0% |
| Whites/Caucasians | 100.0 /100 | #15 | Exceptional 7.0% |
| Europeans | 100.0 /100 | #16 | Exceptional 7.1% |
Demographics Similar to Cree by No Vehicles in Household
In terms of no vehicles in household, the demographic groups most similar to Cree are Ute (11.6%, a difference of 0.24%), Russian (11.6%, a difference of 0.29%), Kiowa (11.5%, a difference of 0.35%), Immigrants from Peru (11.5%, a difference of 0.73%), and Taiwanese (11.7%, a difference of 0.75%).
| Demographics | Rating | Rank | No Vehicles in Household |
| Ugandans | 5.3 /100 | #229 | Tragic 11.4% |
| Immigrants | Norway | 5.1 /100 | #230 | Tragic 11.4% |
| Immigrants | Japan | 5.1 /100 | #231 | Tragic 11.4% |
| Immigrants | Turkey | 4.8 /100 | #232 | Tragic 11.5% |
| Houma | 4.7 /100 | #233 | Tragic 11.5% |
| Immigrants | Peru | 4.5 /100 | #234 | Tragic 11.5% |
| Kiowa | 4.0 /100 | #235 | Tragic 11.5% |
| Cree | 3.5 /100 | #236 | Tragic 11.6% |
| Ute | 3.3 /100 | #237 | Tragic 11.6% |
| Russians | 3.2 /100 | #238 | Tragic 11.6% |
| Taiwanese | 2.8 /100 | #239 | Tragic 11.7% |
| Immigrants | Immigrants | 2.7 /100 | #240 | Tragic 11.7% |
| Eastern Europeans | 2.7 /100 | #241 | Tragic 11.7% |
| Turks | 2.6 /100 | #242 | Tragic 11.7% |
| Cheyenne | 2.4 /100 | #243 | Tragic 11.7% |