Scotch-Irish vs Greek No Vehicles in Household
COMPARE
Scotch-Irish
Greek
No Vehicles in Household
No Vehicles in Household Comparison
Scotch-Irish
Greeks
6.8%
NO VEHICLES IN HOUSEHOLD
100.0/ 100
METRIC RATING
9th/ 347
METRIC RANK
9.5%
NO VEHICLES IN HOUSEHOLD
92.9/ 100
METRIC RATING
118th/ 347
METRIC RANK
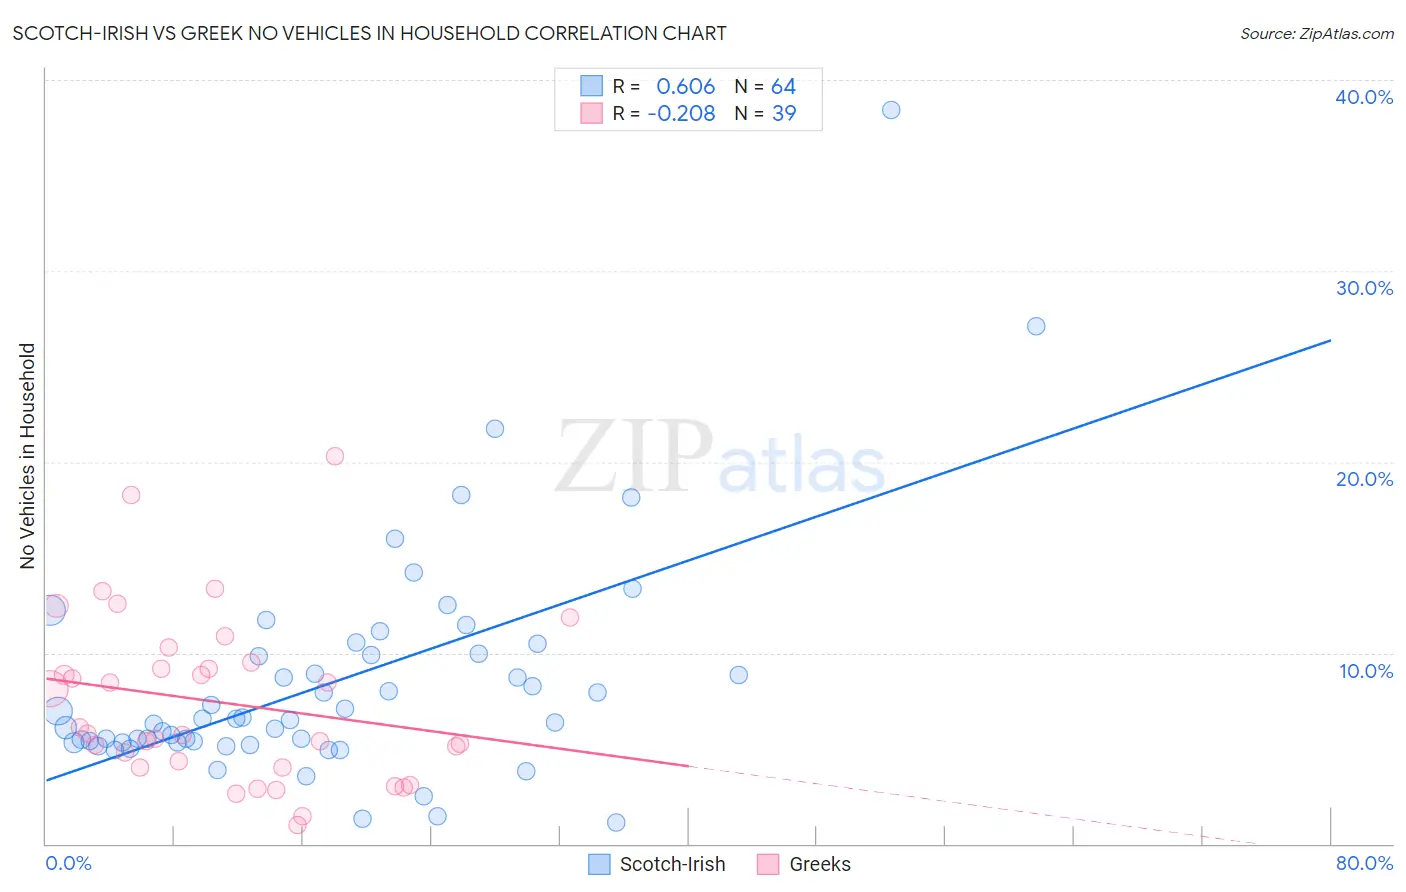
Scotch-Irish vs Greek No Vehicles in Household Correlation Chart
The statistical analysis conducted on geographies consisting of 544,331,951 people shows a significant positive correlation between the proportion of Scotch-Irish and percentage of households with no vehicle available in the United States with a correlation coefficient (R) of 0.606 and weighted average of 6.8%. Similarly, the statistical analysis conducted on geographies consisting of 480,584,341 people shows a weak negative correlation between the proportion of Greeks and percentage of households with no vehicle available in the United States with a correlation coefficient (R) of -0.208 and weighted average of 9.5%, a difference of 39.5%.
No Vehicles in Household Correlation Summary
| Measurement | Scotch-Irish | Greek |
| Minimum | 1.1% | 1.00% |
| Maximum | 38.5% | 20.3% |
| Range | 37.4% | 19.3% |
| Mean | 8.4% | 7.4% |
| Median | 6.5% | 5.7% |
| Interquartile 25% (IQ1) | 5.3% | 4.0% |
| Interquartile 75% (IQ3) | 9.9% | 9.5% |
| Interquartile Range (IQR) | 4.6% | 5.5% |
| Standard Deviation (Sample) | 6.0% | 4.4% |
| Standard Deviation (Population) | 6.0% | 4.4% |
Similar Demographics by No Vehicles in Household
Demographics Similar to Scotch-Irish by No Vehicles in Household
In terms of no vehicles in household, the demographic groups most similar to Scotch-Irish are Swedish (6.8%, a difference of 0.21%), Dutch (6.8%, a difference of 0.51%), Scottish (6.8%, a difference of 0.68%), Czech (6.9%, a difference of 1.1%), and German (6.7%, a difference of 2.0%).
| Demographics | Rating | Rank | No Vehicles in Household |
| Norwegians | 100.0 /100 | #2 | Exceptional 6.4% |
| English | 100.0 /100 | #3 | Exceptional 6.5% |
| Danes | 100.0 /100 | #4 | Exceptional 6.6% |
| Yakama | 100.0 /100 | #5 | Exceptional 6.6% |
| Germans | 100.0 /100 | #6 | Exceptional 6.7% |
| Scottish | 100.0 /100 | #7 | Exceptional 6.8% |
| Swedes | 100.0 /100 | #8 | Exceptional 6.8% |
| Scotch-Irish | 100.0 /100 | #9 | Exceptional 6.8% |
| Dutch | 100.0 /100 | #10 | Exceptional 6.8% |
| Czechs | 100.0 /100 | #11 | Exceptional 6.9% |
| Assyrians/Chaldeans/Syriacs | 100.0 /100 | #12 | Exceptional 7.0% |
| Scandinavians | 100.0 /100 | #13 | Exceptional 7.0% |
| Mexicans | 100.0 /100 | #14 | Exceptional 7.0% |
| Whites/Caucasians | 100.0 /100 | #15 | Exceptional 7.0% |
| Europeans | 100.0 /100 | #16 | Exceptional 7.1% |
Demographics Similar to Greeks by No Vehicles in Household
In terms of no vehicles in household, the demographic groups most similar to Greeks are Fijian (9.5%, a difference of 0.11%), Immigrants from Thailand (9.5%, a difference of 0.17%), Puget Sound Salish (9.5%, a difference of 0.27%), Costa Rican (9.5%, a difference of 0.32%), and Chippewa (9.4%, a difference of 0.55%).
| Demographics | Rating | Rank | No Vehicles in Household |
| Immigrants | Kuwait | 95.1 /100 | #111 | Exceptional 9.4% |
| Armenians | 95.0 /100 | #112 | Exceptional 9.4% |
| Immigrants | Netherlands | 94.8 /100 | #113 | Exceptional 9.4% |
| Serbians | 94.3 /100 | #114 | Exceptional 9.4% |
| Navajo | 94.2 /100 | #115 | Exceptional 9.4% |
| Japanese | 94.1 /100 | #116 | Exceptional 9.4% |
| Chippewa | 93.8 /100 | #117 | Exceptional 9.4% |
| Greeks | 92.9 /100 | #118 | Exceptional 9.5% |
| Fijians | 92.7 /100 | #119 | Exceptional 9.5% |
| Immigrants | Thailand | 92.6 /100 | #120 | Exceptional 9.5% |
| Puget Sound Salish | 92.4 /100 | #121 | Exceptional 9.5% |
| Costa Ricans | 92.3 /100 | #122 | Exceptional 9.5% |
| Blackfeet | 91.4 /100 | #123 | Exceptional 9.6% |
| Immigrants | Korea | 90.9 /100 | #124 | Exceptional 9.6% |
| Immigrants | Cameroon | 90.6 /100 | #125 | Exceptional 9.6% |