Scotch-Irish vs Immigrants from El Salvador No Vehicles in Household
COMPARE
Scotch-Irish
Immigrants from El Salvador
No Vehicles in Household
No Vehicles in Household Comparison
Scotch-Irish
Immigrants from El Salvador
6.8%
NO VEHICLES IN HOUSEHOLD
100.0/ 100
METRIC RATING
9th/ 347
METRIC RANK
10.4%
NO VEHICLES IN HOUSEHOLD
49.1/ 100
METRIC RATING
177th/ 347
METRIC RANK
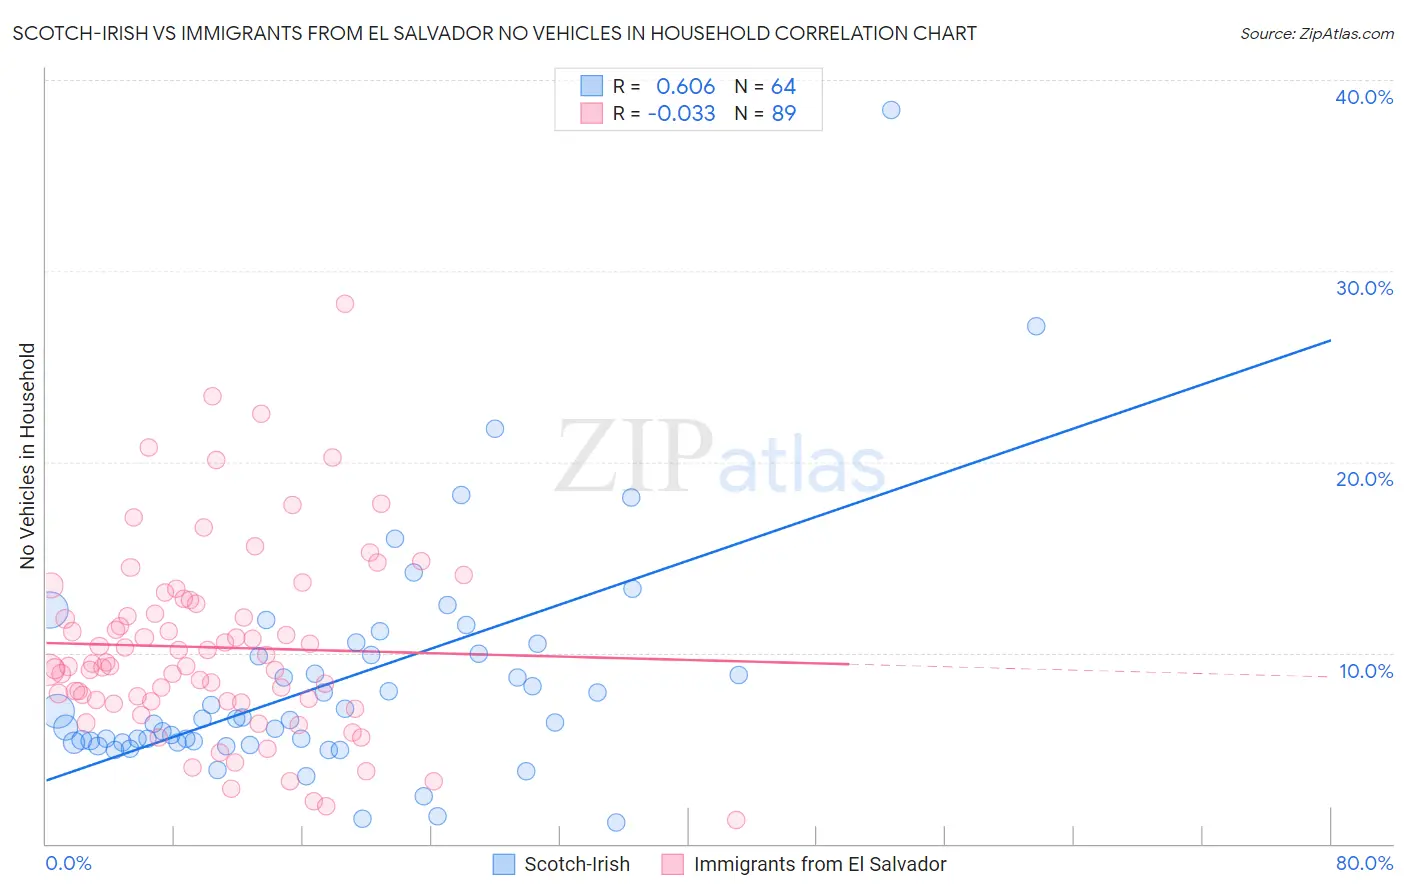
Scotch-Irish vs Immigrants from El Salvador No Vehicles in Household Correlation Chart
The statistical analysis conducted on geographies consisting of 544,331,951 people shows a significant positive correlation between the proportion of Scotch-Irish and percentage of households with no vehicle available in the United States with a correlation coefficient (R) of 0.606 and weighted average of 6.8%. Similarly, the statistical analysis conducted on geographies consisting of 357,255,745 people shows no correlation between the proportion of Immigrants from El Salvador and percentage of households with no vehicle available in the United States with a correlation coefficient (R) of -0.033 and weighted average of 10.4%, a difference of 53.0%.
No Vehicles in Household Correlation Summary
| Measurement | Scotch-Irish | Immigrants from El Salvador |
| Minimum | 1.1% | 1.3% |
| Maximum | 38.5% | 28.3% |
| Range | 37.4% | 27.0% |
| Mean | 8.4% | 10.3% |
| Median | 6.5% | 9.3% |
| Interquartile 25% (IQ1) | 5.3% | 7.4% |
| Interquartile 75% (IQ3) | 9.9% | 12.7% |
| Interquartile Range (IQR) | 4.6% | 5.2% |
| Standard Deviation (Sample) | 6.0% | 4.9% |
| Standard Deviation (Population) | 6.0% | 4.9% |
Similar Demographics by No Vehicles in Household
Demographics Similar to Scotch-Irish by No Vehicles in Household
In terms of no vehicles in household, the demographic groups most similar to Scotch-Irish are Swedish (6.8%, a difference of 0.21%), Dutch (6.8%, a difference of 0.51%), Scottish (6.8%, a difference of 0.68%), Czech (6.9%, a difference of 1.1%), and German (6.7%, a difference of 2.0%).
| Demographics | Rating | Rank | No Vehicles in Household |
| Norwegians | 100.0 /100 | #2 | Exceptional 6.4% |
| English | 100.0 /100 | #3 | Exceptional 6.5% |
| Danes | 100.0 /100 | #4 | Exceptional 6.6% |
| Yakama | 100.0 /100 | #5 | Exceptional 6.6% |
| Germans | 100.0 /100 | #6 | Exceptional 6.7% |
| Scottish | 100.0 /100 | #7 | Exceptional 6.8% |
| Swedes | 100.0 /100 | #8 | Exceptional 6.8% |
| Scotch-Irish | 100.0 /100 | #9 | Exceptional 6.8% |
| Dutch | 100.0 /100 | #10 | Exceptional 6.8% |
| Czechs | 100.0 /100 | #11 | Exceptional 6.9% |
| Assyrians/Chaldeans/Syriacs | 100.0 /100 | #12 | Exceptional 7.0% |
| Scandinavians | 100.0 /100 | #13 | Exceptional 7.0% |
| Mexicans | 100.0 /100 | #14 | Exceptional 7.0% |
| Whites/Caucasians | 100.0 /100 | #15 | Exceptional 7.0% |
| Europeans | 100.0 /100 | #16 | Exceptional 7.1% |
Demographics Similar to Immigrants from El Salvador by No Vehicles in Household
In terms of no vehicles in household, the demographic groups most similar to Immigrants from El Salvador are Immigrants from Burma/Myanmar (10.4%, a difference of 0.010%), French American Indian (10.4%, a difference of 0.010%), Immigrants from Sudan (10.4%, a difference of 0.13%), Filipino (10.4%, a difference of 0.14%), and Immigrants from Ethiopia (10.4%, a difference of 0.15%).
| Demographics | Rating | Rank | No Vehicles in Household |
| Immigrants | Latin America | 53.2 /100 | #170 | Average 10.4% |
| Hmong | 52.7 /100 | #171 | Average 10.4% |
| Brazilians | 51.7 /100 | #172 | Average 10.4% |
| Filipinos | 50.1 /100 | #173 | Average 10.4% |
| Immigrants | Sudan | 50.0 /100 | #174 | Average 10.4% |
| Immigrants | Burma/Myanmar | 49.1 /100 | #175 | Average 10.4% |
| French American Indians | 49.1 /100 | #176 | Average 10.4% |
| Immigrants | El Salvador | 49.1 /100 | #177 | Average 10.4% |
| Immigrants | Ethiopia | 48.0 /100 | #178 | Average 10.4% |
| Ethiopians | 45.8 /100 | #179 | Average 10.5% |
| Arabs | 45.3 /100 | #180 | Average 10.5% |
| Immigrants | Colombia | 44.1 /100 | #181 | Average 10.5% |
| Immigrants | Bulgaria | 43.8 /100 | #182 | Average 10.5% |
| Natives/Alaskans | 43.7 /100 | #183 | Average 10.5% |
| Immigrants | Nepal | 42.4 /100 | #184 | Average 10.5% |