Scotch-Irish vs Panamanian No Vehicles in Household
COMPARE
Scotch-Irish
Panamanian
No Vehicles in Household
No Vehicles in Household Comparison
Scotch-Irish
Panamanians
6.8%
NO VEHICLES IN HOUSEHOLD
100.0/ 100
METRIC RATING
9th/ 347
METRIC RANK
12.5%
NO VEHICLES IN HOUSEHOLD
0.2/ 100
METRIC RATING
269th/ 347
METRIC RANK
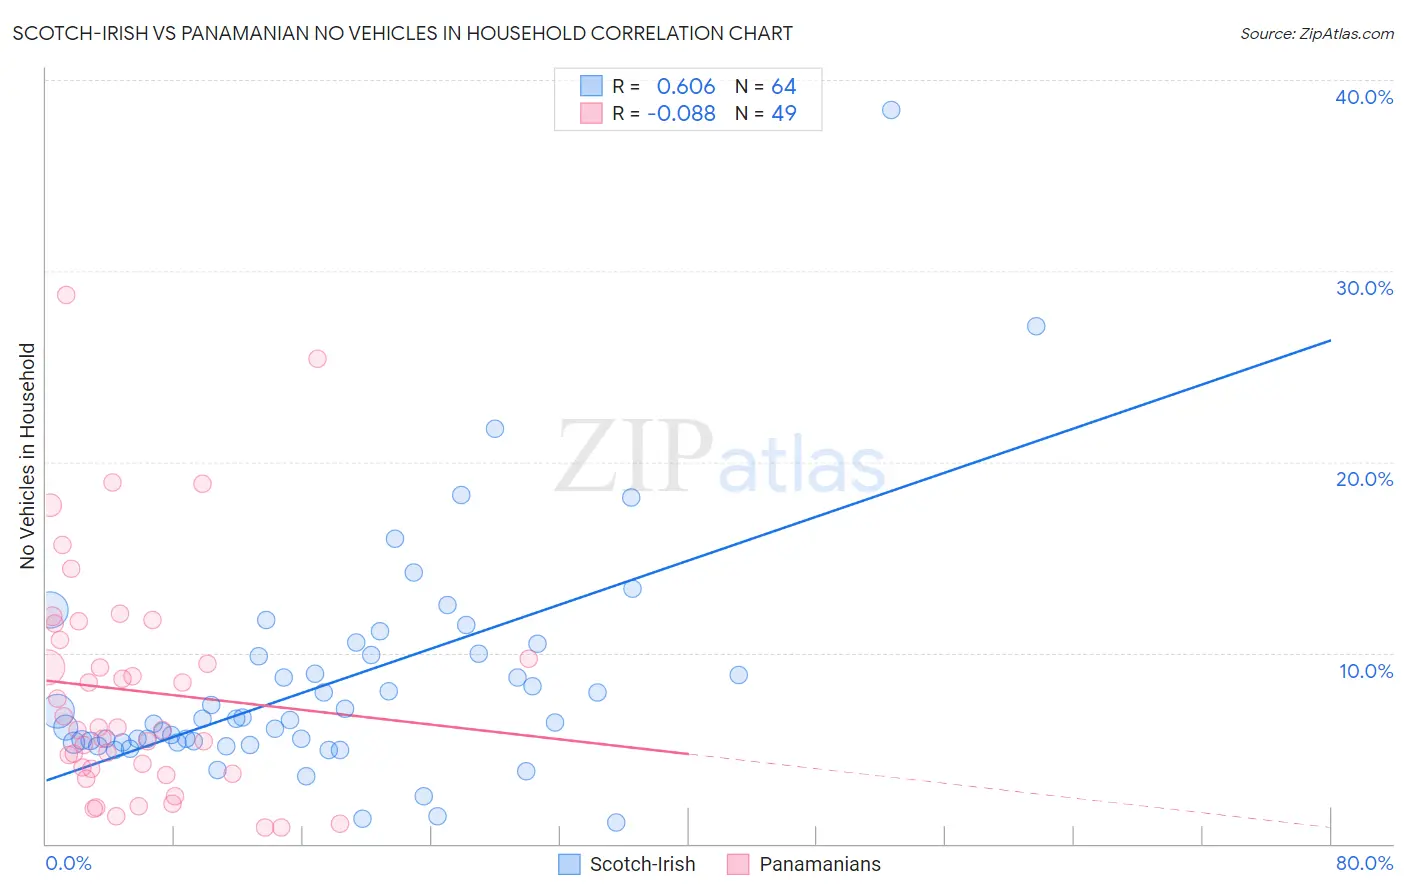
Scotch-Irish vs Panamanian No Vehicles in Household Correlation Chart
The statistical analysis conducted on geographies consisting of 544,331,951 people shows a significant positive correlation between the proportion of Scotch-Irish and percentage of households with no vehicle available in the United States with a correlation coefficient (R) of 0.606 and weighted average of 6.8%. Similarly, the statistical analysis conducted on geographies consisting of 280,874,828 people shows a slight negative correlation between the proportion of Panamanians and percentage of households with no vehicle available in the United States with a correlation coefficient (R) of -0.088 and weighted average of 12.5%, a difference of 84.1%.
No Vehicles in Household Correlation Summary
| Measurement | Scotch-Irish | Panamanian |
| Minimum | 1.1% | 0.82% |
| Maximum | 38.5% | 28.8% |
| Range | 37.4% | 27.9% |
| Mean | 8.4% | 8.0% |
| Median | 6.5% | 6.1% |
| Interquartile 25% (IQ1) | 5.3% | 3.8% |
| Interquartile 75% (IQ3) | 9.9% | 11.1% |
| Interquartile Range (IQR) | 4.6% | 7.3% |
| Standard Deviation (Sample) | 6.0% | 6.1% |
| Standard Deviation (Population) | 6.0% | 6.1% |
Similar Demographics by No Vehicles in Household
Demographics Similar to Scotch-Irish by No Vehicles in Household
In terms of no vehicles in household, the demographic groups most similar to Scotch-Irish are Swedish (6.8%, a difference of 0.21%), Dutch (6.8%, a difference of 0.51%), Scottish (6.8%, a difference of 0.68%), Czech (6.9%, a difference of 1.1%), and German (6.7%, a difference of 2.0%).
| Demographics | Rating | Rank | No Vehicles in Household |
| Norwegians | 100.0 /100 | #2 | Exceptional 6.4% |
| English | 100.0 /100 | #3 | Exceptional 6.5% |
| Danes | 100.0 /100 | #4 | Exceptional 6.6% |
| Yakama | 100.0 /100 | #5 | Exceptional 6.6% |
| Germans | 100.0 /100 | #6 | Exceptional 6.7% |
| Scottish | 100.0 /100 | #7 | Exceptional 6.8% |
| Swedes | 100.0 /100 | #8 | Exceptional 6.8% |
| Scotch-Irish | 100.0 /100 | #9 | Exceptional 6.8% |
| Dutch | 100.0 /100 | #10 | Exceptional 6.8% |
| Czechs | 100.0 /100 | #11 | Exceptional 6.9% |
| Assyrians/Chaldeans/Syriacs | 100.0 /100 | #12 | Exceptional 7.0% |
| Scandinavians | 100.0 /100 | #13 | Exceptional 7.0% |
| Mexicans | 100.0 /100 | #14 | Exceptional 7.0% |
| Whites/Caucasians | 100.0 /100 | #15 | Exceptional 7.0% |
| Europeans | 100.0 /100 | #16 | Exceptional 7.1% |
Demographics Similar to Panamanians by No Vehicles in Household
In terms of no vehicles in household, the demographic groups most similar to Panamanians are Immigrants from Africa (12.5%, a difference of 0.13%), Immigrants from Europe (12.5%, a difference of 0.18%), Immigrants from Northern Africa (12.6%, a difference of 0.55%), Immigrants from Morocco (12.6%, a difference of 0.67%), and Israeli (12.4%, a difference of 0.76%).
| Demographics | Rating | Rank | No Vehicles in Household |
| Immigrants | Liberia | 0.6 /100 | #262 | Tragic 12.2% |
| Immigrants | Egypt | 0.6 /100 | #263 | Tragic 12.2% |
| Immigrants | Switzerland | 0.5 /100 | #264 | Tragic 12.3% |
| Africans | 0.4 /100 | #265 | Tragic 12.3% |
| Israelis | 0.3 /100 | #266 | Tragic 12.4% |
| Immigrants | Europe | 0.3 /100 | #267 | Tragic 12.5% |
| Immigrants | Africa | 0.2 /100 | #268 | Tragic 12.5% |
| Panamanians | 0.2 /100 | #269 | Tragic 12.5% |
| Immigrants | Northern Africa | 0.2 /100 | #270 | Tragic 12.6% |
| Immigrants | Morocco | 0.2 /100 | #271 | Tragic 12.6% |
| Bermudans | 0.1 /100 | #272 | Tragic 12.8% |
| Immigrants | France | 0.1 /100 | #273 | Tragic 12.9% |
| Immigrants | Singapore | 0.1 /100 | #274 | Tragic 12.9% |
| Immigrants | Albania | 0.1 /100 | #275 | Tragic 13.0% |
| Immigrants | Southern Europe | 0.1 /100 | #276 | Tragic 13.0% |