Nonimmigrants vs Inupiat Male Poverty
COMPARE
Nonimmigrants
Inupiat
Male Poverty
Male Poverty Comparison
Nonimmigrants
Inupiat
12.1%
MALE POVERTY
3.1/ 100
METRIC RATING
213th/ 347
METRIC RANK
14.0%
MALE POVERTY
0.0/ 100
METRIC RATING
297th/ 347
METRIC RANK
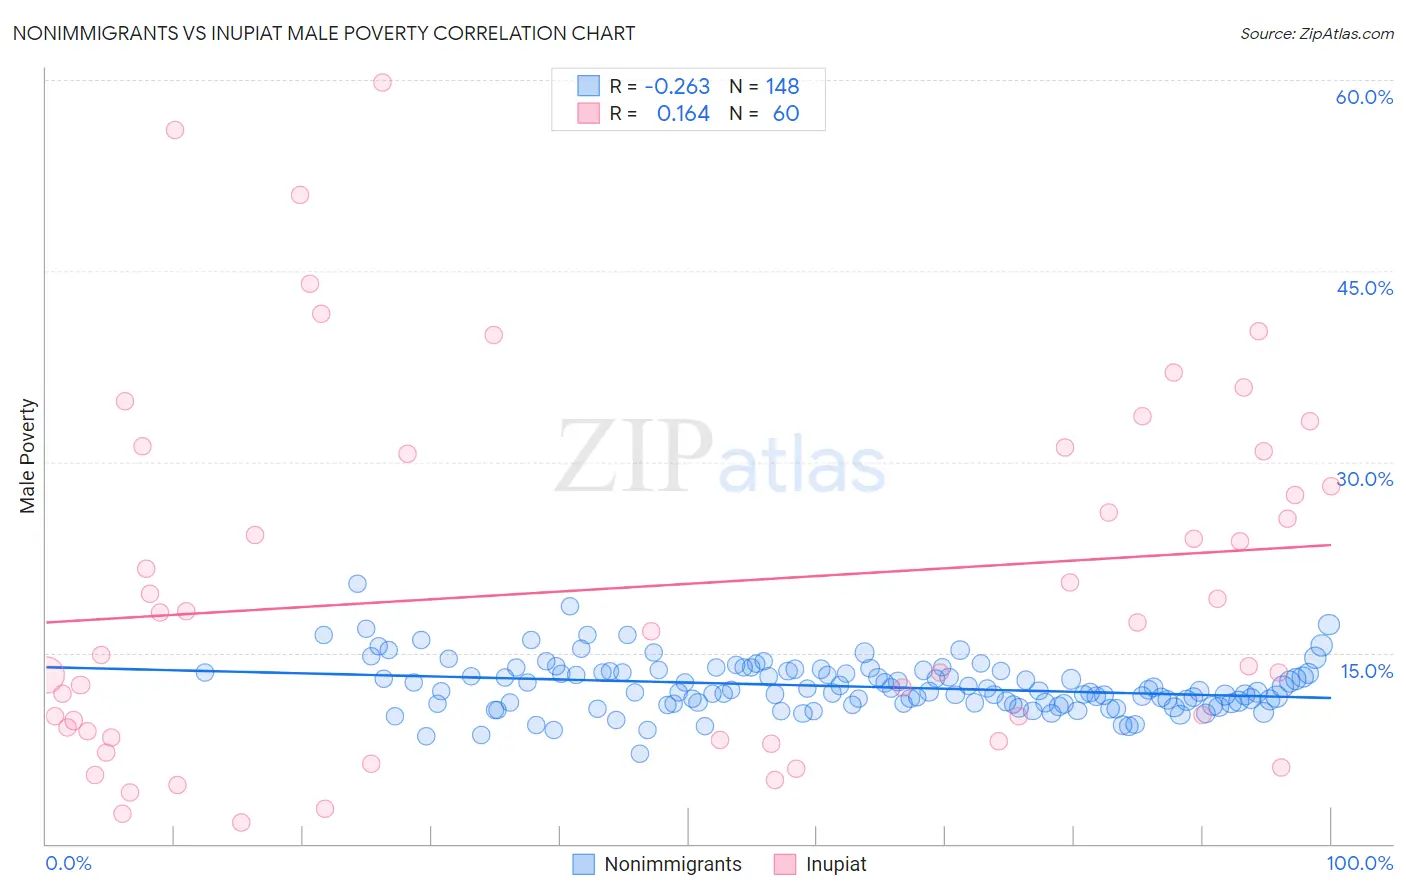
Nonimmigrants vs Inupiat Male Poverty Correlation Chart
The statistical analysis conducted on geographies consisting of 582,696,583 people shows a weak negative correlation between the proportion of Nonimmigrants and poverty level among males in the United States with a correlation coefficient (R) of -0.263 and weighted average of 12.1%. Similarly, the statistical analysis conducted on geographies consisting of 96,314,568 people shows a poor positive correlation between the proportion of Inupiat and poverty level among males in the United States with a correlation coefficient (R) of 0.164 and weighted average of 14.0%, a difference of 15.4%.
Male Poverty Correlation Summary
| Measurement | Nonimmigrants | Inupiat |
| Minimum | 7.0% | 1.7% |
| Maximum | 20.4% | 59.8% |
| Range | 13.4% | 58.1% |
| Mean | 12.4% | 20.1% |
| Median | 12.0% | 17.0% |
| Interquartile 25% (IQ1) | 11.0% | 8.6% |
| Interquartile 75% (IQ3) | 13.5% | 30.7% |
| Interquartile Range (IQR) | 2.5% | 22.1% |
| Standard Deviation (Sample) | 2.0% | 14.1% |
| Standard Deviation (Population) | 2.0% | 14.0% |
Similar Demographics by Male Poverty
Demographics Similar to Nonimmigrants by Male Poverty
In terms of male poverty, the demographic groups most similar to Nonimmigrants are American (12.1%, a difference of 0.040%), Japanese (12.2%, a difference of 0.32%), Immigrants from Uzbekistan (12.2%, a difference of 0.43%), Immigrants from Cambodia (12.2%, a difference of 0.51%), and Immigrants from Thailand (12.2%, a difference of 0.52%).
| Demographics | Rating | Rank | Male Poverty |
| Immigrants | Eastern Africa | 5.4 /100 | #206 | Tragic 12.0% |
| Malaysians | 5.2 /100 | #207 | Tragic 12.0% |
| Immigrants | Immigrants | 4.5 /100 | #208 | Tragic 12.0% |
| Immigrants | Azores | 4.3 /100 | #209 | Tragic 12.0% |
| Moroccans | 4.2 /100 | #210 | Tragic 12.0% |
| Immigrants | Panama | 4.0 /100 | #211 | Tragic 12.1% |
| Americans | 3.2 /100 | #212 | Tragic 12.1% |
| Immigrants | Nonimmigrants | 3.1 /100 | #213 | Tragic 12.1% |
| Japanese | 2.7 /100 | #214 | Tragic 12.2% |
| Immigrants | Uzbekistan | 2.6 /100 | #215 | Tragic 12.2% |
| Immigrants | Cambodia | 2.5 /100 | #216 | Tragic 12.2% |
| Immigrants | Thailand | 2.5 /100 | #217 | Tragic 12.2% |
| German Russians | 2.5 /100 | #218 | Tragic 12.2% |
| Bermudans | 2.4 /100 | #219 | Tragic 12.2% |
| Immigrants | Eritrea | 2.4 /100 | #220 | Tragic 12.2% |
Demographics Similar to Inupiat by Male Poverty
In terms of male poverty, the demographic groups most similar to Inupiat are Blackfeet (14.0%, a difference of 0.030%), Immigrants from Guatemala (14.0%, a difference of 0.13%), Immigrants from Mexico (14.0%, a difference of 0.25%), Immigrants from Senegal (14.0%, a difference of 0.32%), and Immigrants from Caribbean (14.0%, a difference of 0.37%).
| Demographics | Rating | Rank | Male Poverty |
| Immigrants | Zaire | 0.0 /100 | #290 | Tragic 13.8% |
| Vietnamese | 0.0 /100 | #291 | Tragic 13.8% |
| Indonesians | 0.0 /100 | #292 | Tragic 13.8% |
| Immigrants | Belize | 0.0 /100 | #293 | Tragic 13.8% |
| Hispanics or Latinos | 0.0 /100 | #294 | Tragic 13.9% |
| Immigrants | Central America | 0.0 /100 | #295 | Tragic 13.9% |
| Cajuns | 0.0 /100 | #296 | Tragic 13.9% |
| Inupiat | 0.0 /100 | #297 | Tragic 14.0% |
| Blackfeet | 0.0 /100 | #298 | Tragic 14.0% |
| Immigrants | Guatemala | 0.0 /100 | #299 | Tragic 14.0% |
| Immigrants | Mexico | 0.0 /100 | #300 | Tragic 14.0% |
| Immigrants | Senegal | 0.0 /100 | #301 | Tragic 14.0% |
| Immigrants | Caribbean | 0.0 /100 | #302 | Tragic 14.0% |
| Bahamians | 0.0 /100 | #303 | Tragic 14.1% |
| Senegalese | 0.0 /100 | #304 | Tragic 14.1% |