Native/Alaskan vs Immigrants from Oceania 3 or more Vehicles in Household
COMPARE
Native/Alaskan
Immigrants from Oceania
3 or more Vehicles in Household
3 or more Vehicles in Household Comparison
Natives/Alaskans
Immigrants from Oceania
22.7%
3 OR MORE VEHICLES IN HOUSEHOLD
100.0/ 100
METRIC RATING
42nd/ 347
METRIC RANK
21.8%
3 OR MORE VEHICLES IN HOUSEHOLD
99.8/ 100
METRIC RATING
74th/ 347
METRIC RANK
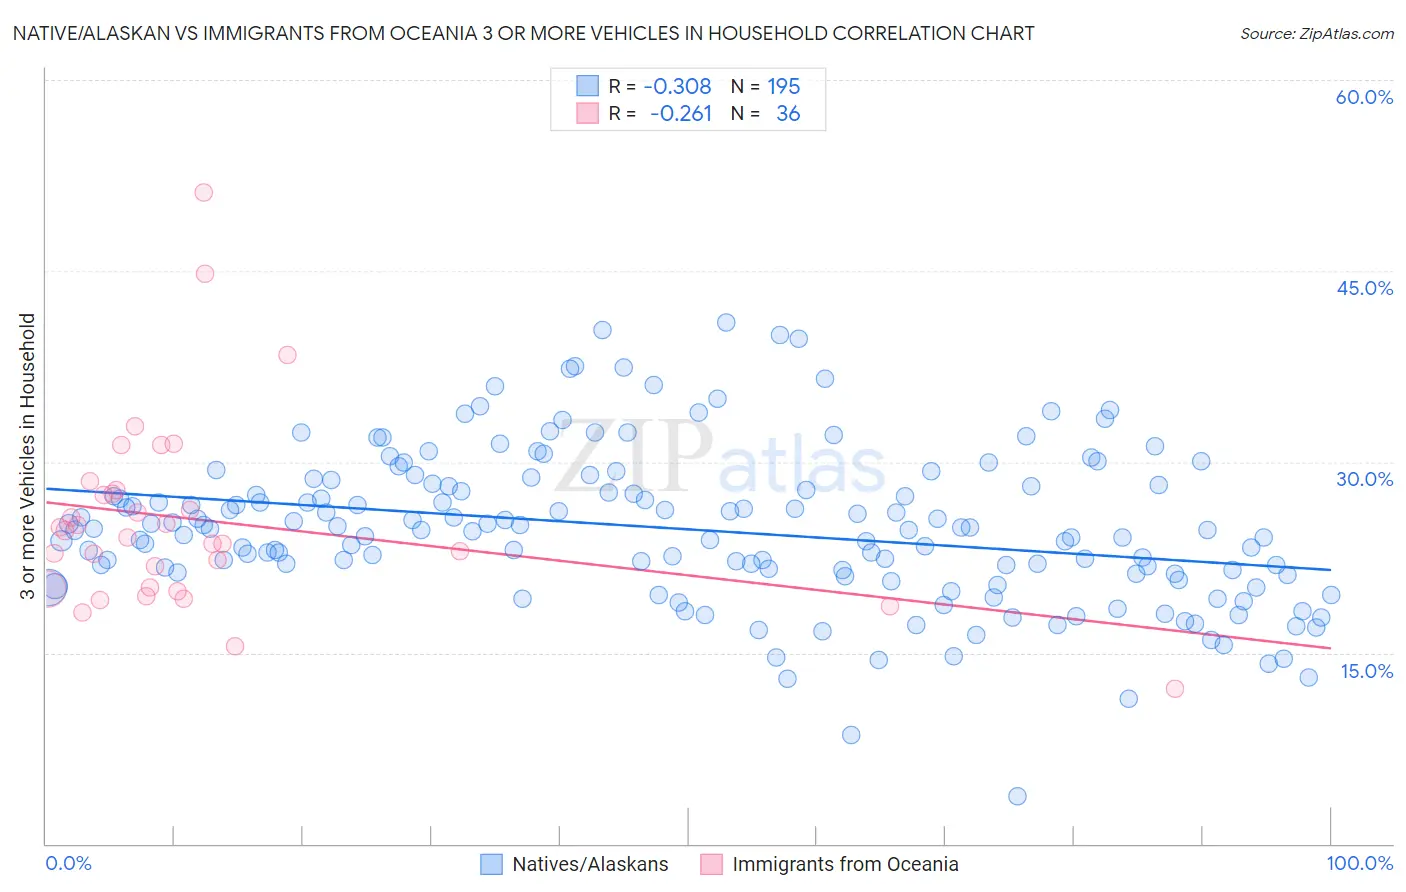
Native/Alaskan vs Immigrants from Oceania 3 or more Vehicles in Household Correlation Chart
The statistical analysis conducted on geographies consisting of 512,441,086 people shows a mild negative correlation between the proportion of Natives/Alaskans and percentage of households with 3 or more vehicles available in the United States with a correlation coefficient (R) of -0.308 and weighted average of 22.7%. Similarly, the statistical analysis conducted on geographies consisting of 305,272,843 people shows a weak negative correlation between the proportion of Immigrants from Oceania and percentage of households with 3 or more vehicles available in the United States with a correlation coefficient (R) of -0.261 and weighted average of 21.8%, a difference of 4.3%.
3 or more Vehicles in Household Correlation Summary
| Measurement | Native/Alaskan | Immigrants from Oceania |
| Minimum | 3.7% | 12.2% |
| Maximum | 40.9% | 51.2% |
| Range | 37.2% | 39.0% |
| Mean | 24.7% | 25.4% |
| Median | 24.6% | 24.3% |
| Interquartile 25% (IQ1) | 21.2% | 20.1% |
| Interquartile 75% (IQ3) | 28.1% | 27.6% |
| Interquartile Range (IQR) | 6.9% | 7.6% |
| Standard Deviation (Sample) | 6.0% | 7.6% |
| Standard Deviation (Population) | 6.0% | 7.5% |
Similar Demographics by 3 or more Vehicles in Household
Demographics Similar to Natives/Alaskans by 3 or more Vehicles in Household
In terms of 3 or more vehicles in household, the demographic groups most similar to Natives/Alaskans are German (22.7%, a difference of 0.0%), Osage (22.7%, a difference of 0.11%), Cheyenne (22.7%, a difference of 0.25%), Ute (22.7%, a difference of 0.35%), and European (22.9%, a difference of 0.47%).
| Demographics | Rating | Rank | 3 or more Vehicles in Household |
| Choctaw | 100.0 /100 | #35 | Exceptional 23.0% |
| Cherokee | 100.0 /100 | #36 | Exceptional 23.0% |
| Swedes | 100.0 /100 | #37 | Exceptional 23.0% |
| Dutch | 100.0 /100 | #38 | Exceptional 22.9% |
| Yaqui | 100.0 /100 | #39 | Exceptional 22.9% |
| Europeans | 100.0 /100 | #40 | Exceptional 22.9% |
| Germans | 100.0 /100 | #41 | Exceptional 22.7% |
| Natives/Alaskans | 100.0 /100 | #42 | Exceptional 22.7% |
| Osage | 100.0 /100 | #43 | Exceptional 22.7% |
| Cheyenne | 100.0 /100 | #44 | Exceptional 22.7% |
| Ute | 100.0 /100 | #45 | Exceptional 22.7% |
| Americans | 100.0 /100 | #46 | Exceptional 22.6% |
| Malaysians | 100.0 /100 | #47 | Exceptional 22.6% |
| Scottish | 100.0 /100 | #48 | Exceptional 22.6% |
| Scotch-Irish | 100.0 /100 | #49 | Exceptional 22.6% |
Demographics Similar to Immigrants from Oceania by 3 or more Vehicles in Household
In terms of 3 or more vehicles in household, the demographic groups most similar to Immigrants from Oceania are Salvadoran (21.8%, a difference of 0.020%), Japanese (21.8%, a difference of 0.10%), Portuguese (21.8%, a difference of 0.11%), Nonimmigrants (21.8%, a difference of 0.15%), and Irish (21.8%, a difference of 0.22%).
| Demographics | Rating | Rank | 3 or more Vehicles in Household |
| Alaskan Athabascans | 99.9 /100 | #67 | Exceptional 21.9% |
| British | 99.9 /100 | #68 | Exceptional 21.9% |
| Creek | 99.9 /100 | #69 | Exceptional 21.9% |
| Bangladeshis | 99.8 /100 | #70 | Exceptional 21.9% |
| Potawatomi | 99.8 /100 | #71 | Exceptional 21.9% |
| Portuguese | 99.8 /100 | #72 | Exceptional 21.8% |
| Salvadorans | 99.8 /100 | #73 | Exceptional 21.8% |
| Immigrants | Oceania | 99.8 /100 | #74 | Exceptional 21.8% |
| Japanese | 99.8 /100 | #75 | Exceptional 21.8% |
| Immigrants | Nonimmigrants | 99.8 /100 | #76 | Exceptional 21.8% |
| Irish | 99.8 /100 | #77 | Exceptional 21.8% |
| Czechoslovakians | 99.8 /100 | #78 | Exceptional 21.7% |
| Assyrians/Chaldeans/Syriacs | 99.8 /100 | #79 | Exceptional 21.7% |
| Afghans | 99.7 /100 | #80 | Exceptional 21.7% |
| Celtics | 99.7 /100 | #81 | Exceptional 21.7% |