Immigrants from Serbia vs Immigrants from Oceania 3 or more Vehicles in Household
COMPARE
Immigrants from Serbia
Immigrants from Oceania
3 or more Vehicles in Household
3 or more Vehicles in Household Comparison
Immigrants from Serbia
Immigrants from Oceania
16.4%
3 OR MORE VEHICLES IN HOUSEHOLD
0.0/ 100
METRIC RATING
303rd/ 347
METRIC RANK
21.8%
3 OR MORE VEHICLES IN HOUSEHOLD
99.8/ 100
METRIC RATING
74th/ 347
METRIC RANK
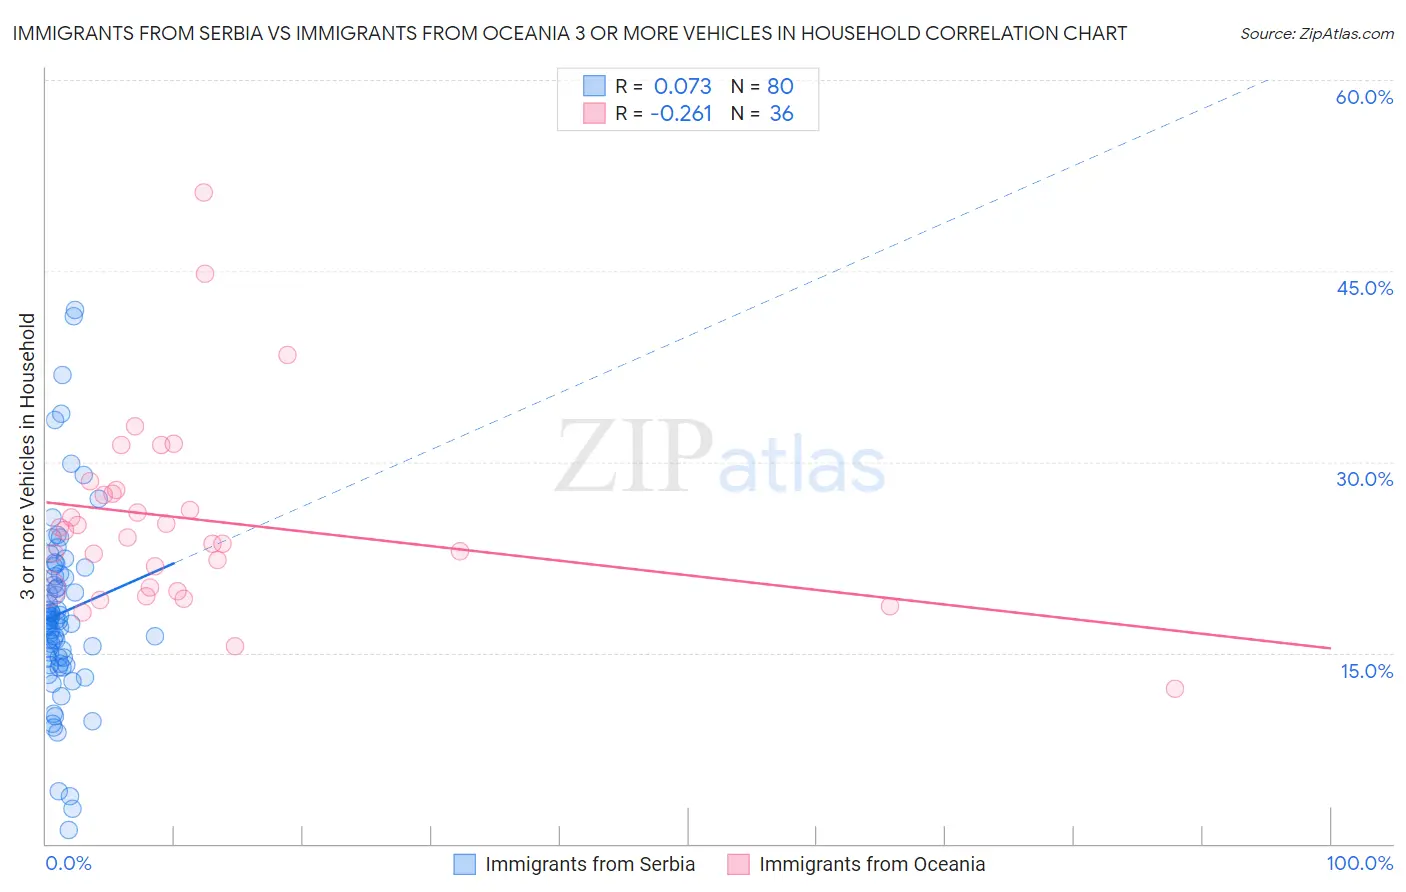
Immigrants from Serbia vs Immigrants from Oceania 3 or more Vehicles in Household Correlation Chart
The statistical analysis conducted on geographies consisting of 131,699,405 people shows a slight positive correlation between the proportion of Immigrants from Serbia and percentage of households with 3 or more vehicles available in the United States with a correlation coefficient (R) of 0.073 and weighted average of 16.4%. Similarly, the statistical analysis conducted on geographies consisting of 305,272,843 people shows a weak negative correlation between the proportion of Immigrants from Oceania and percentage of households with 3 or more vehicles available in the United States with a correlation coefficient (R) of -0.261 and weighted average of 21.8%, a difference of 32.7%.
3 or more Vehicles in Household Correlation Summary
| Measurement | Immigrants from Serbia | Immigrants from Oceania |
| Minimum | 1.1% | 12.2% |
| Maximum | 41.9% | 51.2% |
| Range | 40.8% | 39.0% |
| Mean | 18.1% | 25.4% |
| Median | 17.4% | 24.3% |
| Interquartile 25% (IQ1) | 14.4% | 20.1% |
| Interquartile 75% (IQ3) | 21.1% | 27.6% |
| Interquartile Range (IQR) | 6.7% | 7.6% |
| Standard Deviation (Sample) | 7.4% | 7.6% |
| Standard Deviation (Population) | 7.4% | 7.5% |
Similar Demographics by 3 or more Vehicles in Household
Demographics Similar to Immigrants from Serbia by 3 or more Vehicles in Household
In terms of 3 or more vehicles in household, the demographic groups most similar to Immigrants from Serbia are Immigrants from Greece (16.5%, a difference of 0.31%), Ghanaian (16.4%, a difference of 0.47%), Paraguayan (16.6%, a difference of 0.73%), Immigrants from Morocco (16.3%, a difference of 0.74%), and Cypriot (16.6%, a difference of 1.1%).
| Demographics | Rating | Rank | 3 or more Vehicles in Household |
| Inupiat | 0.1 /100 | #296 | Tragic 16.9% |
| Israelis | 0.1 /100 | #297 | Tragic 16.8% |
| Immigrants | Zaire | 0.1 /100 | #298 | Tragic 16.7% |
| Immigrants | South America | 0.1 /100 | #299 | Tragic 16.7% |
| Cypriots | 0.0 /100 | #300 | Tragic 16.6% |
| Paraguayans | 0.0 /100 | #301 | Tragic 16.6% |
| Immigrants | Greece | 0.0 /100 | #302 | Tragic 16.5% |
| Immigrants | Serbia | 0.0 /100 | #303 | Tragic 16.4% |
| Ghanaians | 0.0 /100 | #304 | Tragic 16.4% |
| Immigrants | Morocco | 0.0 /100 | #305 | Tragic 16.3% |
| Somalis | 0.0 /100 | #306 | Tragic 16.2% |
| Immigrants | Ghana | 0.0 /100 | #307 | Tragic 16.2% |
| Houma | 0.0 /100 | #308 | Tragic 16.1% |
| Immigrants | Somalia | 0.0 /100 | #309 | Tragic 15.9% |
| Moroccans | 0.0 /100 | #310 | Tragic 15.9% |
Demographics Similar to Immigrants from Oceania by 3 or more Vehicles in Household
In terms of 3 or more vehicles in household, the demographic groups most similar to Immigrants from Oceania are Salvadoran (21.8%, a difference of 0.020%), Japanese (21.8%, a difference of 0.10%), Portuguese (21.8%, a difference of 0.11%), Nonimmigrants (21.8%, a difference of 0.15%), and Irish (21.8%, a difference of 0.22%).
| Demographics | Rating | Rank | 3 or more Vehicles in Household |
| Alaskan Athabascans | 99.9 /100 | #67 | Exceptional 21.9% |
| British | 99.9 /100 | #68 | Exceptional 21.9% |
| Creek | 99.9 /100 | #69 | Exceptional 21.9% |
| Bangladeshis | 99.8 /100 | #70 | Exceptional 21.9% |
| Potawatomi | 99.8 /100 | #71 | Exceptional 21.9% |
| Portuguese | 99.8 /100 | #72 | Exceptional 21.8% |
| Salvadorans | 99.8 /100 | #73 | Exceptional 21.8% |
| Immigrants | Oceania | 99.8 /100 | #74 | Exceptional 21.8% |
| Japanese | 99.8 /100 | #75 | Exceptional 21.8% |
| Immigrants | Nonimmigrants | 99.8 /100 | #76 | Exceptional 21.8% |
| Irish | 99.8 /100 | #77 | Exceptional 21.8% |
| Czechoslovakians | 99.8 /100 | #78 | Exceptional 21.7% |
| Assyrians/Chaldeans/Syriacs | 99.8 /100 | #79 | Exceptional 21.7% |
| Afghans | 99.7 /100 | #80 | Exceptional 21.7% |
| Celtics | 99.7 /100 | #81 | Exceptional 21.7% |