Belgian vs Immigrants from Oceania 3 or more Vehicles in Household
COMPARE
Belgian
Immigrants from Oceania
3 or more Vehicles in Household
3 or more Vehicles in Household Comparison
Belgians
Immigrants from Oceania
21.2%
3 OR MORE VEHICLES IN HOUSEHOLD
98.9/ 100
METRIC RATING
91st/ 347
METRIC RANK
21.8%
3 OR MORE VEHICLES IN HOUSEHOLD
99.8/ 100
METRIC RATING
74th/ 347
METRIC RANK
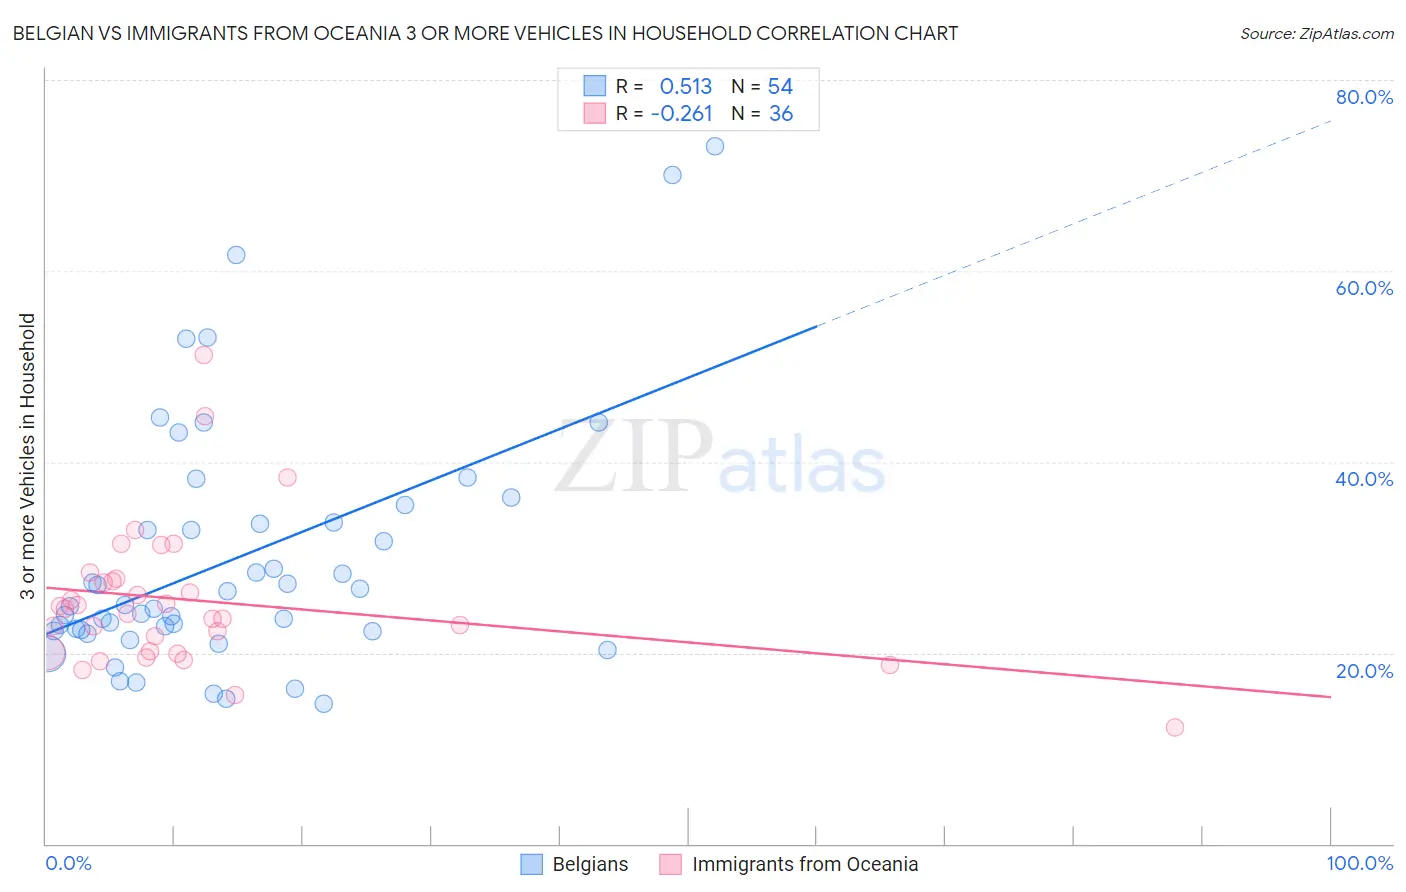
Belgian vs Immigrants from Oceania 3 or more Vehicles in Household Correlation Chart
The statistical analysis conducted on geographies consisting of 355,741,877 people shows a substantial positive correlation between the proportion of Belgians and percentage of households with 3 or more vehicles available in the United States with a correlation coefficient (R) of 0.513 and weighted average of 21.2%. Similarly, the statistical analysis conducted on geographies consisting of 305,272,843 people shows a weak negative correlation between the proportion of Immigrants from Oceania and percentage of households with 3 or more vehicles available in the United States with a correlation coefficient (R) of -0.261 and weighted average of 21.8%, a difference of 3.0%.
3 or more Vehicles in Household Correlation Summary
| Measurement | Belgian | Immigrants from Oceania |
| Minimum | 14.7% | 12.2% |
| Maximum | 73.1% | 51.2% |
| Range | 58.4% | 39.0% |
| Mean | 29.9% | 25.4% |
| Median | 25.0% | 24.3% |
| Interquartile 25% (IQ1) | 22.3% | 20.1% |
| Interquartile 75% (IQ3) | 33.6% | 27.6% |
| Interquartile Range (IQR) | 11.3% | 7.6% |
| Standard Deviation (Sample) | 13.1% | 7.6% |
| Standard Deviation (Population) | 12.9% | 7.5% |
Demographics Similar to Belgians and Immigrants from Oceania by 3 or more Vehicles in Household
In terms of 3 or more vehicles in household, the demographic groups most similar to Belgians are Apache (21.2%, a difference of 0.080%), Immigrants from Afghanistan (21.2%, a difference of 0.33%), Marshallese (21.3%, a difference of 0.55%), French (21.4%, a difference of 1.1%), and Immigrants from the Azores (21.5%, a difference of 1.4%). Similarly, the demographic groups most similar to Immigrants from Oceania are Salvadoran (21.8%, a difference of 0.020%), Japanese (21.8%, a difference of 0.10%), Portuguese (21.8%, a difference of 0.11%), Nonimmigrants (21.8%, a difference of 0.15%), and Irish (21.8%, a difference of 0.22%).
| Demographics | Rating | Rank | 3 or more Vehicles in Household |
| Portuguese | 99.8 /100 | #72 | Exceptional 21.8% |
| Salvadorans | 99.8 /100 | #73 | Exceptional 21.8% |
| Immigrants | Oceania | 99.8 /100 | #74 | Exceptional 21.8% |
| Japanese | 99.8 /100 | #75 | Exceptional 21.8% |
| Immigrants | Nonimmigrants | 99.8 /100 | #76 | Exceptional 21.8% |
| Irish | 99.8 /100 | #77 | Exceptional 21.8% |
| Czechoslovakians | 99.8 /100 | #78 | Exceptional 21.7% |
| Assyrians/Chaldeans/Syriacs | 99.8 /100 | #79 | Exceptional 21.7% |
| Afghans | 99.7 /100 | #80 | Exceptional 21.7% |
| Celtics | 99.7 /100 | #81 | Exceptional 21.7% |
| Immigrants | El Salvador | 99.6 /100 | #82 | Exceptional 21.5% |
| Chippewa | 99.6 /100 | #83 | Exceptional 21.5% |
| Icelanders | 99.6 /100 | #84 | Exceptional 21.5% |
| Laotians | 99.6 /100 | #85 | Exceptional 21.5% |
| Delaware | 99.6 /100 | #86 | Exceptional 21.5% |
| Immigrants | Azores | 99.5 /100 | #87 | Exceptional 21.5% |
| French | 99.4 /100 | #88 | Exceptional 21.4% |
| Marshallese | 99.2 /100 | #89 | Exceptional 21.3% |
| Immigrants | Afghanistan | 99.1 /100 | #90 | Exceptional 21.2% |
| Belgians | 98.9 /100 | #91 | Exceptional 21.2% |
| Apache | 98.9 /100 | #92 | Exceptional 21.2% |