Native/Alaskan vs Liberian 3 or more Vehicles in Household
COMPARE
Native/Alaskan
Liberian
3 or more Vehicles in Household
3 or more Vehicles in Household Comparison
Natives/Alaskans
Liberians
22.7%
3 OR MORE VEHICLES IN HOUSEHOLD
100.0/ 100
METRIC RATING
42nd/ 347
METRIC RANK
17.0%
3 OR MORE VEHICLES IN HOUSEHOLD
0.1/ 100
METRIC RATING
290th/ 347
METRIC RANK
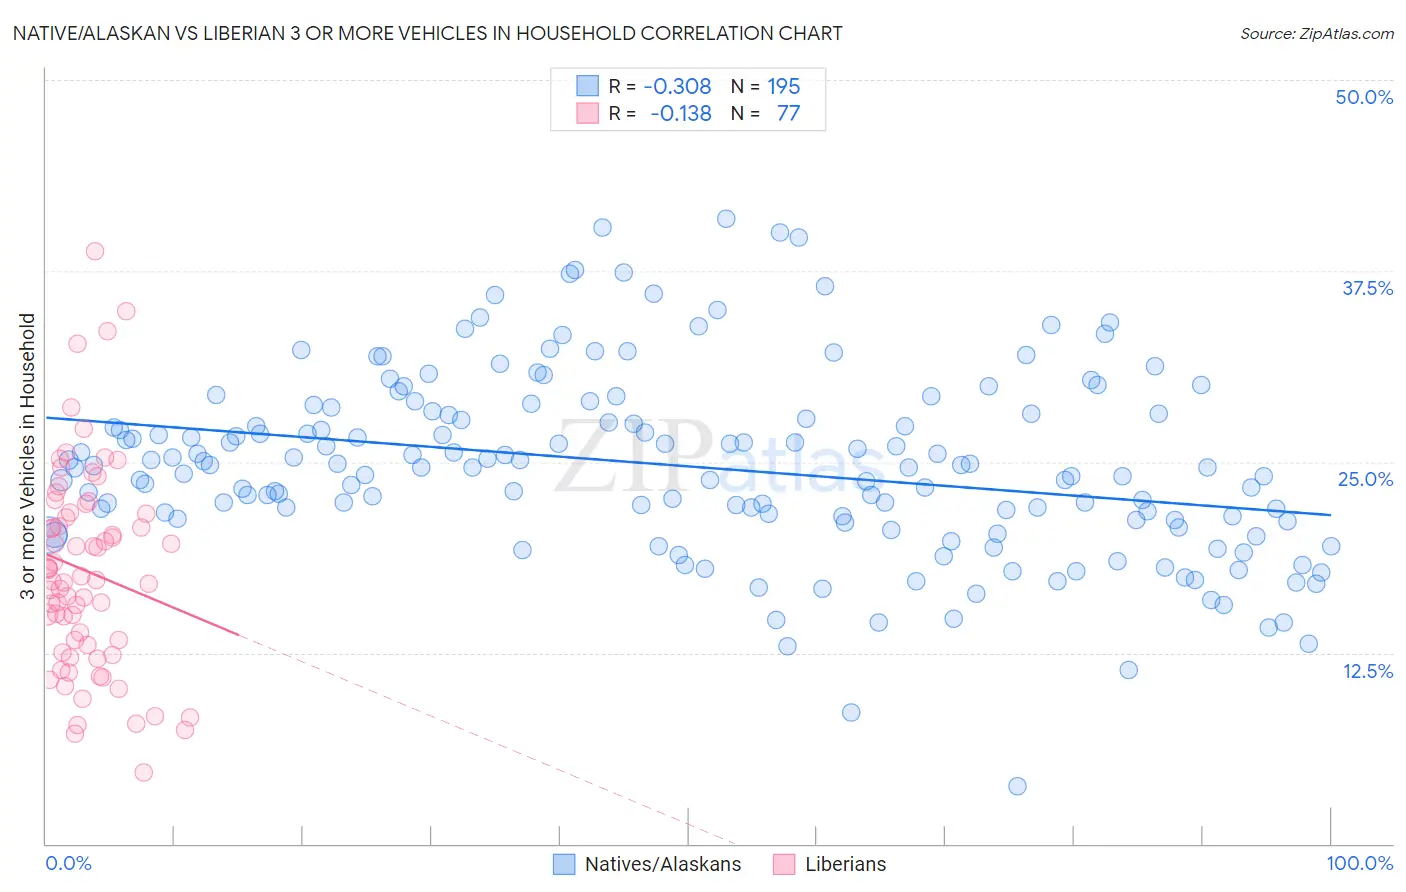
Native/Alaskan vs Liberian 3 or more Vehicles in Household Correlation Chart
The statistical analysis conducted on geographies consisting of 512,441,086 people shows a mild negative correlation between the proportion of Natives/Alaskans and percentage of households with 3 or more vehicles available in the United States with a correlation coefficient (R) of -0.308 and weighted average of 22.7%. Similarly, the statistical analysis conducted on geographies consisting of 118,026,034 people shows a poor negative correlation between the proportion of Liberians and percentage of households with 3 or more vehicles available in the United States with a correlation coefficient (R) of -0.138 and weighted average of 17.0%, a difference of 33.8%.
3 or more Vehicles in Household Correlation Summary
| Measurement | Native/Alaskan | Liberian |
| Minimum | 3.7% | 4.7% |
| Maximum | 40.9% | 38.8% |
| Range | 37.2% | 34.1% |
| Mean | 24.7% | 17.9% |
| Median | 24.6% | 17.2% |
| Interquartile 25% (IQ1) | 21.2% | 12.8% |
| Interquartile 75% (IQ3) | 28.1% | 21.7% |
| Interquartile Range (IQR) | 6.9% | 8.9% |
| Standard Deviation (Sample) | 6.0% | 6.7% |
| Standard Deviation (Population) | 6.0% | 6.7% |
Similar Demographics by 3 or more Vehicles in Household
Demographics Similar to Natives/Alaskans by 3 or more Vehicles in Household
In terms of 3 or more vehicles in household, the demographic groups most similar to Natives/Alaskans are German (22.7%, a difference of 0.0%), Osage (22.7%, a difference of 0.11%), Cheyenne (22.7%, a difference of 0.25%), Ute (22.7%, a difference of 0.35%), and European (22.9%, a difference of 0.47%).
| Demographics | Rating | Rank | 3 or more Vehicles in Household |
| Choctaw | 100.0 /100 | #35 | Exceptional 23.0% |
| Cherokee | 100.0 /100 | #36 | Exceptional 23.0% |
| Swedes | 100.0 /100 | #37 | Exceptional 23.0% |
| Dutch | 100.0 /100 | #38 | Exceptional 22.9% |
| Yaqui | 100.0 /100 | #39 | Exceptional 22.9% |
| Europeans | 100.0 /100 | #40 | Exceptional 22.9% |
| Germans | 100.0 /100 | #41 | Exceptional 22.7% |
| Natives/Alaskans | 100.0 /100 | #42 | Exceptional 22.7% |
| Osage | 100.0 /100 | #43 | Exceptional 22.7% |
| Cheyenne | 100.0 /100 | #44 | Exceptional 22.7% |
| Ute | 100.0 /100 | #45 | Exceptional 22.7% |
| Americans | 100.0 /100 | #46 | Exceptional 22.6% |
| Malaysians | 100.0 /100 | #47 | Exceptional 22.6% |
| Scottish | 100.0 /100 | #48 | Exceptional 22.6% |
| Scotch-Irish | 100.0 /100 | #49 | Exceptional 22.6% |
Demographics Similar to Liberians by 3 or more Vehicles in Household
In terms of 3 or more vehicles in household, the demographic groups most similar to Liberians are Immigrants from Congo (17.0%, a difference of 0.15%), Immigrants from Spain (17.0%, a difference of 0.27%), Bahamian (16.9%, a difference of 0.35%), Immigrants from Western Africa (16.9%, a difference of 0.46%), and Immigrants from Russia (16.9%, a difference of 0.51%).
| Demographics | Rating | Rank | 3 or more Vehicles in Household |
| Blacks/African Americans | 0.3 /100 | #283 | Tragic 17.3% |
| Immigrants | Colombia | 0.3 /100 | #284 | Tragic 17.3% |
| Immigrants | Croatia | 0.2 /100 | #285 | Tragic 17.2% |
| Menominee | 0.2 /100 | #286 | Tragic 17.2% |
| Immigrants | Brazil | 0.2 /100 | #287 | Tragic 17.1% |
| Immigrants | Uruguay | 0.2 /100 | #288 | Tragic 17.1% |
| Immigrants | Liberia | 0.1 /100 | #289 | Tragic 17.1% |
| Liberians | 0.1 /100 | #290 | Tragic 17.0% |
| Immigrants | Congo | 0.1 /100 | #291 | Tragic 17.0% |
| Immigrants | Spain | 0.1 /100 | #292 | Tragic 17.0% |
| Bahamians | 0.1 /100 | #293 | Tragic 16.9% |
| Immigrants | Western Africa | 0.1 /100 | #294 | Tragic 16.9% |
| Immigrants | Russia | 0.1 /100 | #295 | Tragic 16.9% |
| Inupiat | 0.1 /100 | #296 | Tragic 16.9% |
| Israelis | 0.1 /100 | #297 | Tragic 16.8% |