Native/Alaskan vs Immigrants from Oceania Master's Degree
COMPARE
Native/Alaskan
Immigrants from Oceania
Master's Degree
Master's Degree Comparison
Natives/Alaskans
Immigrants from Oceania
9.9%
MASTER'S DEGREE
0.0/ 100
METRIC RATING
336th/ 347
METRIC RANK
14.7%
MASTER'S DEGREE
37.1/ 100
METRIC RATING
186th/ 347
METRIC RANK
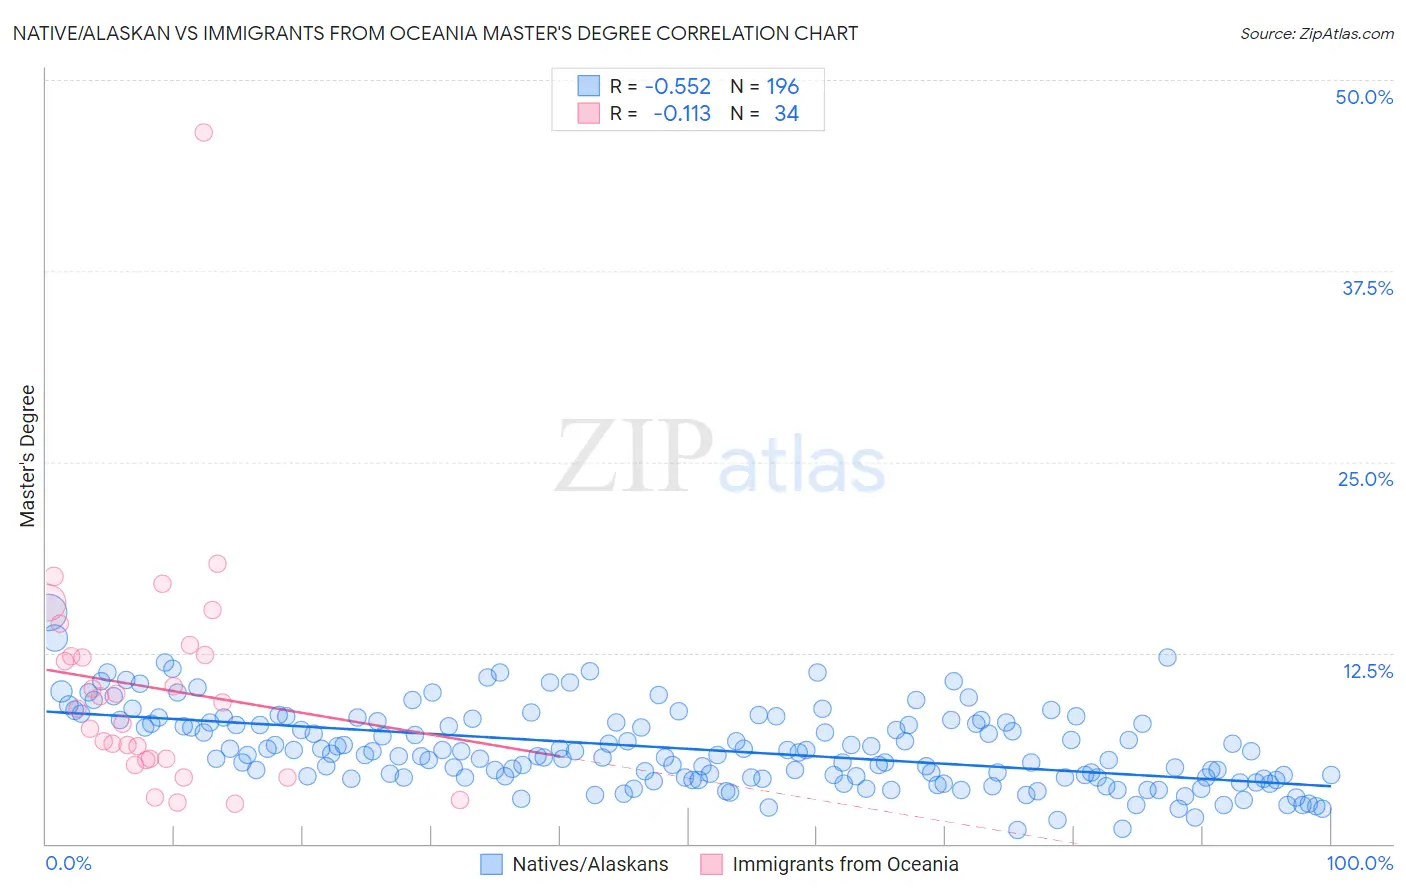
Native/Alaskan vs Immigrants from Oceania Master's Degree Correlation Chart
The statistical analysis conducted on geographies consisting of 512,468,242 people shows a substantial negative correlation between the proportion of Natives/Alaskans and percentage of population with at least master's degree education in the United States with a correlation coefficient (R) of -0.552 and weighted average of 9.9%. Similarly, the statistical analysis conducted on geographies consisting of 305,448,765 people shows a poor negative correlation between the proportion of Immigrants from Oceania and percentage of population with at least master's degree education in the United States with a correlation coefficient (R) of -0.113 and weighted average of 14.7%, a difference of 47.7%.
Master's Degree Correlation Summary
| Measurement | Native/Alaskan | Immigrants from Oceania |
| Minimum | 0.88% | 2.6% |
| Maximum | 15.1% | 46.6% |
| Range | 14.3% | 44.0% |
| Mean | 6.2% | 10.2% |
| Median | 5.9% | 9.0% |
| Interquartile 25% (IQ1) | 4.3% | 5.6% |
| Interquartile 75% (IQ3) | 7.9% | 12.3% |
| Interquartile Range (IQR) | 3.6% | 6.8% |
| Standard Deviation (Sample) | 2.6% | 7.9% |
| Standard Deviation (Population) | 2.6% | 7.7% |
Similar Demographics by Master's Degree
Demographics Similar to Natives/Alaskans by Master's Degree
In terms of master's degree, the demographic groups most similar to Natives/Alaskans are Immigrants from Central America (10.0%, a difference of 0.50%), Arapaho (10.0%, a difference of 0.64%), Mexican (9.7%, a difference of 2.2%), Tohono O'odham (9.7%, a difference of 2.3%), and Menominee (10.2%, a difference of 2.6%).
| Demographics | Rating | Rank | Master's Degree |
| Nepalese | 0.0 /100 | #329 | Tragic 10.5% |
| Fijians | 0.0 /100 | #330 | Tragic 10.3% |
| Pueblo | 0.0 /100 | #331 | Tragic 10.3% |
| Immigrants | Azores | 0.0 /100 | #332 | Tragic 10.2% |
| Menominee | 0.0 /100 | #333 | Tragic 10.2% |
| Arapaho | 0.0 /100 | #334 | Tragic 10.0% |
| Immigrants | Central America | 0.0 /100 | #335 | Tragic 10.0% |
| Natives/Alaskans | 0.0 /100 | #336 | Tragic 9.9% |
| Mexicans | 0.0 /100 | #337 | Tragic 9.7% |
| Tohono O'odham | 0.0 /100 | #338 | Tragic 9.7% |
| Spanish American Indians | 0.0 /100 | #339 | Tragic 9.6% |
| Yakama | 0.0 /100 | #340 | Tragic 9.5% |
| Navajo | 0.0 /100 | #341 | Tragic 9.4% |
| Immigrants | Mexico | 0.0 /100 | #342 | Tragic 9.3% |
| Lumbee | 0.0 /100 | #343 | Tragic 9.3% |
Demographics Similar to Immigrants from Oceania by Master's Degree
In terms of master's degree, the demographic groups most similar to Immigrants from Oceania are Basque (14.7%, a difference of 0.080%), Immigrants from Costa Rica (14.7%, a difference of 0.12%), Barbadian (14.7%, a difference of 0.16%), Immigrants (14.6%, a difference of 0.16%), and Spaniard (14.6%, a difference of 0.19%).
| Demographics | Rating | Rank | Master's Degree |
| Immigrants | Iraq | 41.3 /100 | #179 | Average 14.8% |
| Celtics | 41.3 /100 | #180 | Average 14.8% |
| Swiss | 41.1 /100 | #181 | Average 14.7% |
| Czechs | 40.4 /100 | #182 | Average 14.7% |
| Sri Lankans | 39.6 /100 | #183 | Fair 14.7% |
| Immigrants | Zaire | 39.5 /100 | #184 | Fair 14.7% |
| Barbadians | 38.3 /100 | #185 | Fair 14.7% |
| Immigrants | Oceania | 37.1 /100 | #186 | Fair 14.7% |
| Basques | 36.5 /100 | #187 | Fair 14.7% |
| Immigrants | Costa Rica | 36.2 /100 | #188 | Fair 14.7% |
| Immigrants | Immigrants | 36.0 /100 | #189 | Fair 14.6% |
| Spaniards | 35.8 /100 | #190 | Fair 14.6% |
| Welsh | 34.2 /100 | #191 | Fair 14.6% |
| Immigrants | Middle Africa | 33.6 /100 | #192 | Fair 14.6% |
| Immigrants | Nigeria | 32.7 /100 | #193 | Fair 14.6% |