Filipino vs Immigrants from Ireland No Vehicles in Household
COMPARE
Filipino
Immigrants from Ireland
No Vehicles in Household
No Vehicles in Household Comparison
Filipinos
Immigrants from Ireland
10.4%
NO VEHICLES IN HOUSEHOLD
50.1/ 100
METRIC RATING
173rd/ 347
METRIC RANK
13.7%
NO VEHICLES IN HOUSEHOLD
0.0/ 100
METRIC RATING
287th/ 347
METRIC RANK
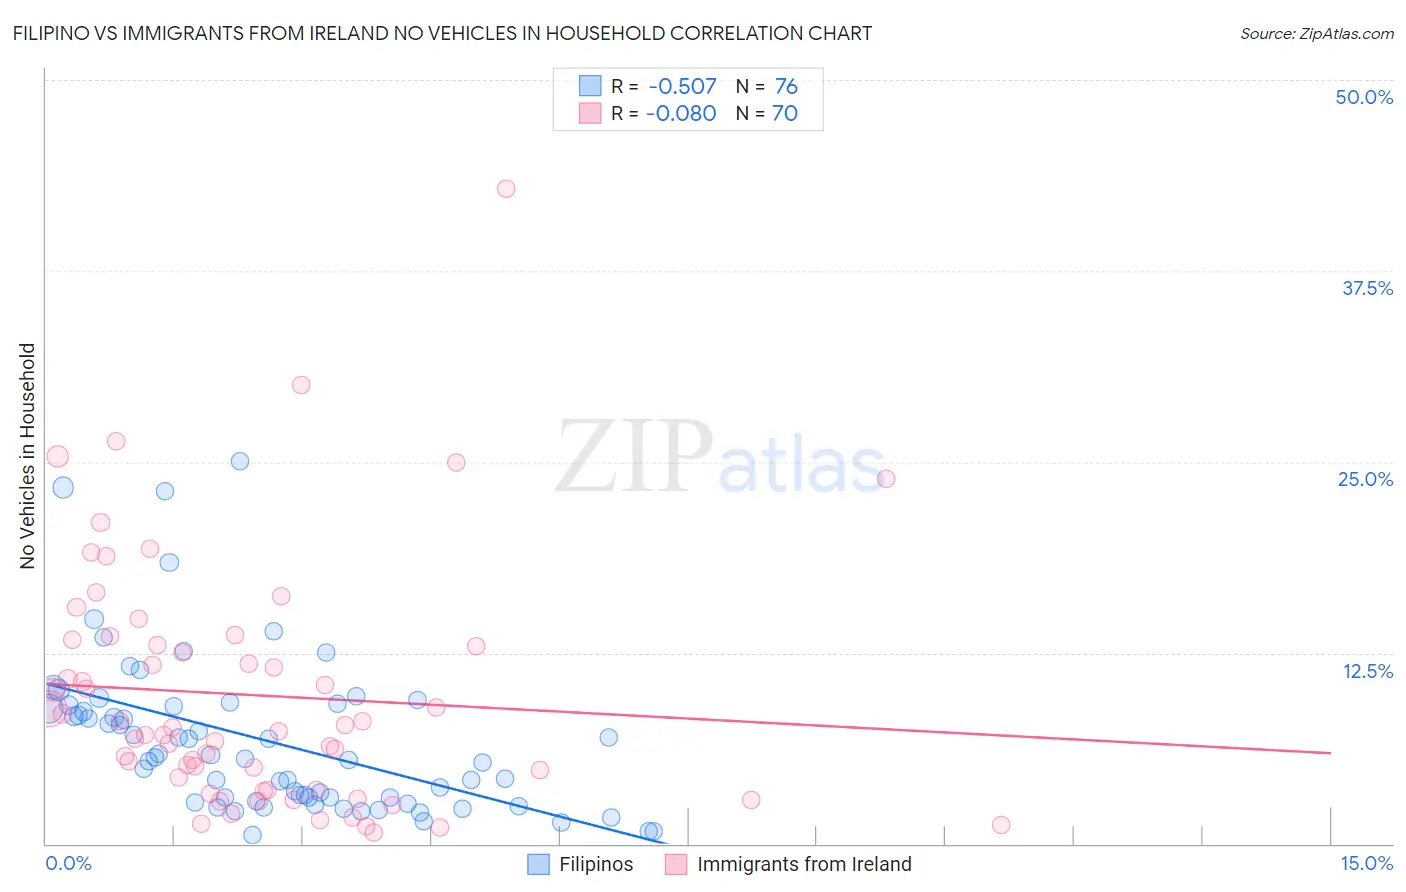
Filipino vs Immigrants from Ireland No Vehicles in Household Correlation Chart
The statistical analysis conducted on geographies consisting of 253,938,776 people shows a substantial negative correlation between the proportion of Filipinos and percentage of households with no vehicle available in the United States with a correlation coefficient (R) of -0.507 and weighted average of 10.4%. Similarly, the statistical analysis conducted on geographies consisting of 240,526,628 people shows a slight negative correlation between the proportion of Immigrants from Ireland and percentage of households with no vehicle available in the United States with a correlation coefficient (R) of -0.080 and weighted average of 13.7%, a difference of 31.8%.
No Vehicles in Household Correlation Summary
| Measurement | Filipino | Immigrants from Ireland |
| Minimum | 0.54% | 0.75% |
| Maximum | 25.0% | 42.9% |
| Range | 24.5% | 42.1% |
| Mean | 6.8% | 9.7% |
| Median | 5.6% | 7.5% |
| Interquartile 25% (IQ1) | 2.9% | 3.5% |
| Interquartile 75% (IQ3) | 9.0% | 13.0% |
| Interquartile Range (IQR) | 6.1% | 9.5% |
| Standard Deviation (Sample) | 5.1% | 8.0% |
| Standard Deviation (Population) | 5.1% | 7.9% |
Similar Demographics by No Vehicles in Household
Demographics Similar to Filipinos by No Vehicles in Household
In terms of no vehicles in household, the demographic groups most similar to Filipinos are Immigrants from Sudan (10.4%, a difference of 0.010%), Immigrants from Burma/Myanmar (10.4%, a difference of 0.13%), French American Indian (10.4%, a difference of 0.13%), Immigrants from El Salvador (10.4%, a difference of 0.14%), and Brazilian (10.4%, a difference of 0.22%).
| Demographics | Rating | Rank | No Vehicles in Household |
| Immigrants | Costa Rica | 60.5 /100 | #166 | Good 10.3% |
| Immigrants | Saudi Arabia | 58.8 /100 | #167 | Average 10.3% |
| Indonesians | 56.7 /100 | #168 | Average 10.3% |
| Lumbee | 54.7 /100 | #169 | Average 10.3% |
| Immigrants | Latin America | 53.2 /100 | #170 | Average 10.4% |
| Hmong | 52.7 /100 | #171 | Average 10.4% |
| Brazilians | 51.7 /100 | #172 | Average 10.4% |
| Filipinos | 50.1 /100 | #173 | Average 10.4% |
| Immigrants | Sudan | 50.0 /100 | #174 | Average 10.4% |
| Immigrants | Burma/Myanmar | 49.1 /100 | #175 | Average 10.4% |
| French American Indians | 49.1 /100 | #176 | Average 10.4% |
| Immigrants | El Salvador | 49.1 /100 | #177 | Average 10.4% |
| Immigrants | Ethiopia | 48.0 /100 | #178 | Average 10.4% |
| Ethiopians | 45.8 /100 | #179 | Average 10.5% |
| Arabs | 45.3 /100 | #180 | Average 10.5% |
Demographics Similar to Immigrants from Ireland by No Vehicles in Household
In terms of no vehicles in household, the demographic groups most similar to Immigrants from Ireland are Hopi (13.7%, a difference of 0.13%), Colville (13.7%, a difference of 0.21%), Immigrants from Australia (13.8%, a difference of 0.80%), Immigrants from Eastern Europe (13.6%, a difference of 0.87%), and Immigrants from Malaysia (13.6%, a difference of 0.92%).
| Demographics | Rating | Rank | No Vehicles in Household |
| Alsatians | 0.0 /100 | #280 | Tragic 13.2% |
| Central American Indians | 0.0 /100 | #281 | Tragic 13.3% |
| Immigrants | Eastern Asia | 0.0 /100 | #282 | Tragic 13.5% |
| Immigrants | Kazakhstan | 0.0 /100 | #283 | Tragic 13.6% |
| Immigrants | Malaysia | 0.0 /100 | #284 | Tragic 13.6% |
| Immigrants | Eastern Europe | 0.0 /100 | #285 | Tragic 13.6% |
| Colville | 0.0 /100 | #286 | Tragic 13.7% |
| Immigrants | Ireland | 0.0 /100 | #287 | Tragic 13.7% |
| Hopi | 0.0 /100 | #288 | Tragic 13.7% |
| Immigrants | Australia | 0.0 /100 | #289 | Tragic 13.8% |
| Indians (Asian) | 0.0 /100 | #290 | Tragic 14.1% |
| Okinawans | 0.0 /100 | #291 | Tragic 14.1% |
| Pima | 0.0 /100 | #292 | Tragic 14.1% |
| Immigrants | Jamaica | 0.0 /100 | #293 | Tragic 14.2% |
| Belizeans | 0.0 /100 | #294 | Tragic 14.3% |