Native/Alaskan vs Immigrants from Ireland Currently Married
COMPARE
Native/Alaskan
Immigrants from Ireland
Currently Married
Currently Married Comparison
Natives/Alaskans
Immigrants from Ireland
42.8%
CURRENTLY MARRIED
0.0/ 100
METRIC RATING
288th/ 347
METRIC RANK
48.4%
CURRENTLY MARRIED
98.5/ 100
METRIC RATING
59th/ 347
METRIC RANK
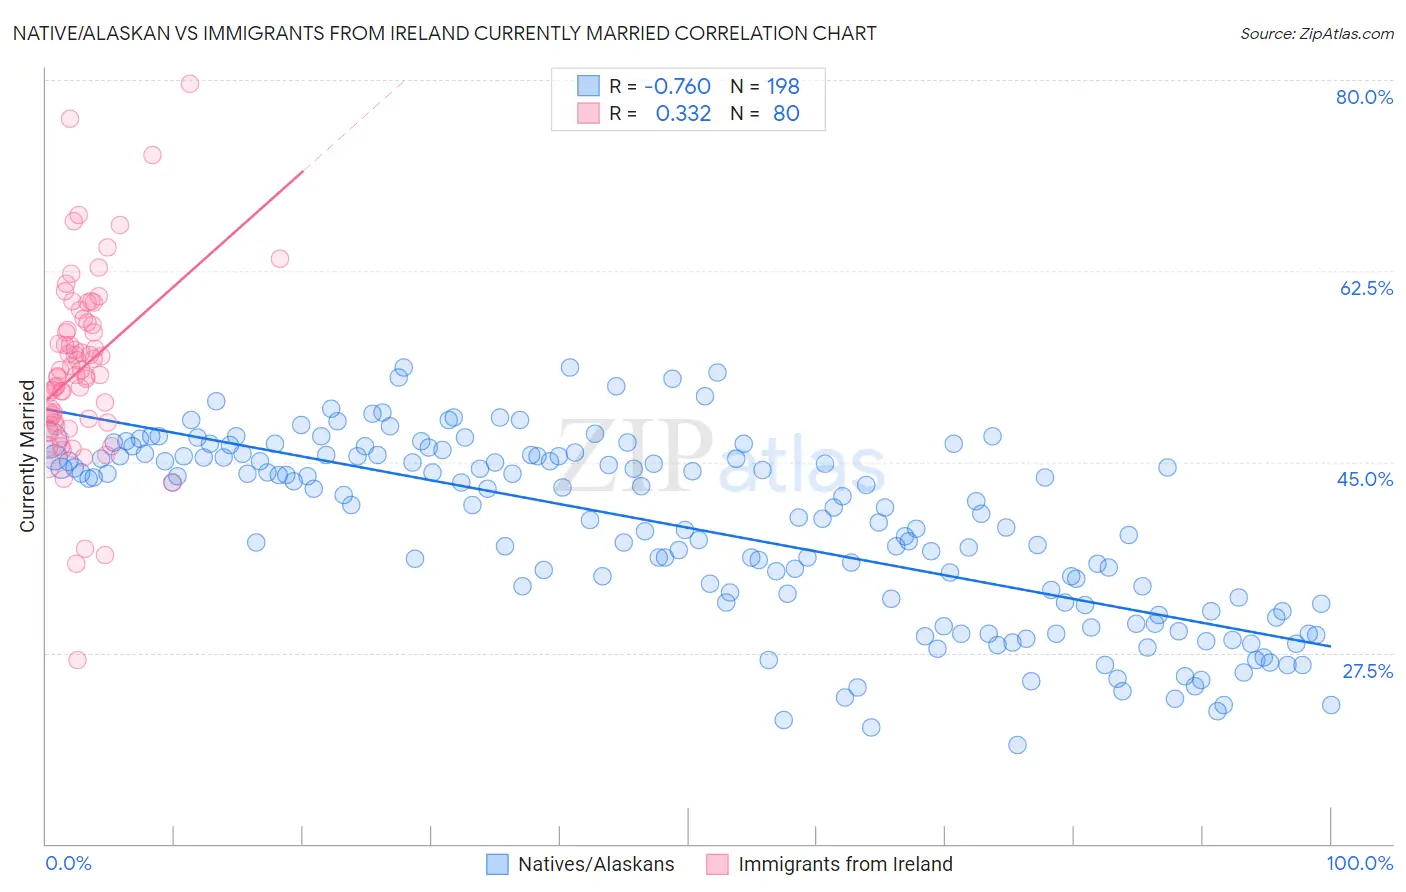
Native/Alaskan vs Immigrants from Ireland Currently Married Correlation Chart
The statistical analysis conducted on geographies consisting of 512,977,387 people shows a strong negative correlation between the proportion of Natives/Alaskans and percentage of population currently married in the United States with a correlation coefficient (R) of -0.760 and weighted average of 42.8%. Similarly, the statistical analysis conducted on geographies consisting of 240,768,579 people shows a mild positive correlation between the proportion of Immigrants from Ireland and percentage of population currently married in the United States with a correlation coefficient (R) of 0.332 and weighted average of 48.4%, a difference of 13.1%.
Currently Married Correlation Summary
| Measurement | Native/Alaskan | Immigrants from Ireland |
| Minimum | 19.1% | 26.8% |
| Maximum | 53.7% | 79.7% |
| Range | 34.6% | 52.9% |
| Mean | 38.9% | 53.5% |
| Median | 41.0% | 53.0% |
| Interquartile 25% (IQ1) | 32.1% | 48.6% |
| Interquartile 75% (IQ3) | 45.5% | 57.7% |
| Interquartile Range (IQR) | 13.5% | 9.1% |
| Standard Deviation (Sample) | 8.3% | 8.4% |
| Standard Deviation (Population) | 8.3% | 8.4% |
Similar Demographics by Currently Married
Demographics Similar to Natives/Alaskans by Currently Married
In terms of currently married, the demographic groups most similar to Natives/Alaskans are Paiute (42.7%, a difference of 0.23%), Immigrants from Ghana (42.7%, a difference of 0.24%), Guatemalan (42.9%, a difference of 0.27%), Ghanaian (42.9%, a difference of 0.29%), and Immigrants from Guatemala (42.6%, a difference of 0.36%).
| Demographics | Rating | Rank | Currently Married |
| Chippewa | 0.0 /100 | #281 | Tragic 43.2% |
| Immigrants | Ecuador | 0.0 /100 | #282 | Tragic 43.2% |
| Kiowa | 0.0 /100 | #283 | Tragic 43.2% |
| Immigrants | El Salvador | 0.0 /100 | #284 | Tragic 43.1% |
| Immigrants | Middle Africa | 0.0 /100 | #285 | Tragic 43.0% |
| Ghanaians | 0.0 /100 | #286 | Tragic 42.9% |
| Guatemalans | 0.0 /100 | #287 | Tragic 42.9% |
| Natives/Alaskans | 0.0 /100 | #288 | Tragic 42.8% |
| Paiute | 0.0 /100 | #289 | Tragic 42.7% |
| Immigrants | Ghana | 0.0 /100 | #290 | Tragic 42.7% |
| Immigrants | Guatemala | 0.0 /100 | #291 | Tragic 42.6% |
| Sub-Saharan Africans | 0.0 /100 | #292 | Tragic 42.6% |
| Yuman | 0.0 /100 | #293 | Tragic 42.6% |
| Hondurans | 0.0 /100 | #294 | Tragic 42.5% |
| Immigrants | Western Africa | 0.0 /100 | #295 | Tragic 42.4% |
Demographics Similar to Immigrants from Ireland by Currently Married
In terms of currently married, the demographic groups most similar to Immigrants from Ireland are Immigrants from Romania (48.4%, a difference of 0.010%), French (48.4%, a difference of 0.030%), Romanian (48.4%, a difference of 0.030%), Asian (48.4%, a difference of 0.030%), and Immigrants from Netherlands (48.5%, a difference of 0.070%).
| Demographics | Rating | Rank | Currently Married |
| Russians | 98.9 /100 | #52 | Exceptional 48.6% |
| Immigrants | Austria | 98.8 /100 | #53 | Exceptional 48.5% |
| Immigrants | Moldova | 98.7 /100 | #54 | Exceptional 48.5% |
| Immigrants | North Macedonia | 98.7 /100 | #55 | Exceptional 48.5% |
| Latvians | 98.7 /100 | #56 | Exceptional 48.5% |
| Immigrants | Netherlands | 98.6 /100 | #57 | Exceptional 48.5% |
| French | 98.6 /100 | #58 | Exceptional 48.4% |
| Immigrants | Ireland | 98.5 /100 | #59 | Exceptional 48.4% |
| Immigrants | Romania | 98.5 /100 | #60 | Exceptional 48.4% |
| Romanians | 98.5 /100 | #61 | Exceptional 48.4% |
| Asians | 98.5 /100 | #62 | Exceptional 48.4% |
| Slavs | 98.3 /100 | #63 | Exceptional 48.4% |
| Immigrants | Czechoslovakia | 98.3 /100 | #64 | Exceptional 48.4% |
| Ukrainians | 98.3 /100 | #65 | Exceptional 48.4% |
| Tongans | 98.2 /100 | #66 | Exceptional 48.3% |