Native/Alaskan vs Immigrants from Ireland Divorced or Separated
COMPARE
Native/Alaskan
Immigrants from Ireland
Divorced or Separated
Divorced or Separated Comparison
Natives/Alaskans
Immigrants from Ireland
13.0%
DIVORCED OR SEPARATED
0.0/ 100
METRIC RATING
297th/ 347
METRIC RANK
11.0%
DIVORCED OR SEPARATED
100.0/ 100
METRIC RATING
30th/ 347
METRIC RANK
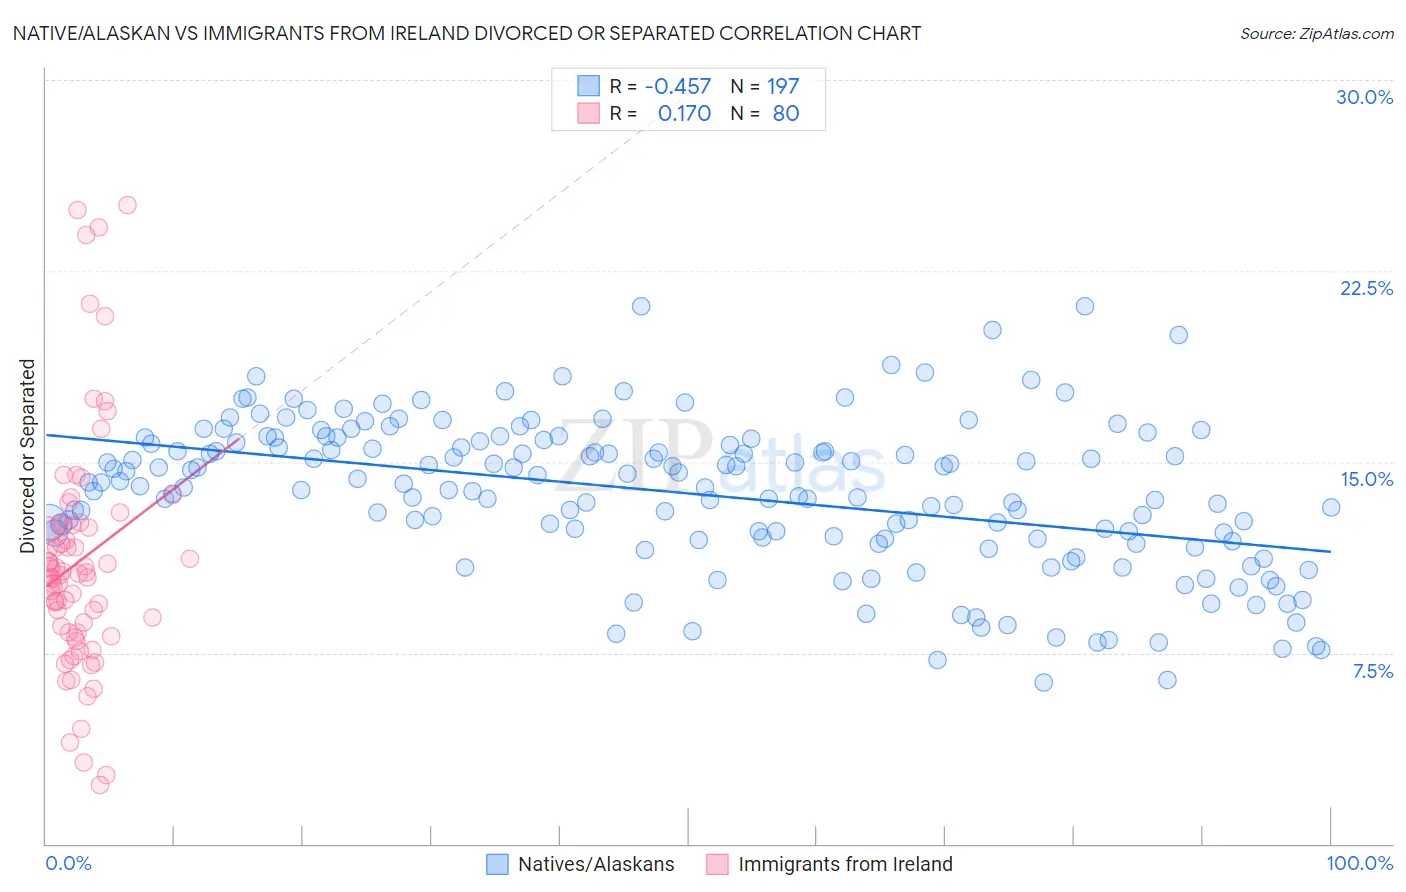
Native/Alaskan vs Immigrants from Ireland Divorced or Separated Correlation Chart
The statistical analysis conducted on geographies consisting of 512,782,555 people shows a moderate negative correlation between the proportion of Natives/Alaskans and percentage of population currently divorced or separated in the United States with a correlation coefficient (R) of -0.457 and weighted average of 13.0%. Similarly, the statistical analysis conducted on geographies consisting of 240,767,381 people shows a poor positive correlation between the proportion of Immigrants from Ireland and percentage of population currently divorced or separated in the United States with a correlation coefficient (R) of 0.170 and weighted average of 11.0%, a difference of 17.9%.
Divorced or Separated Correlation Summary
| Measurement | Native/Alaskan | Immigrants from Ireland |
| Minimum | 6.3% | 2.3% |
| Maximum | 21.1% | 25.1% |
| Range | 14.8% | 22.8% |
| Mean | 13.8% | 11.1% |
| Median | 14.1% | 10.6% |
| Interquartile 25% (IQ1) | 12.0% | 8.3% |
| Interquartile 75% (IQ3) | 15.8% | 12.5% |
| Interquartile Range (IQR) | 3.8% | 4.2% |
| Standard Deviation (Sample) | 2.9% | 4.7% |
| Standard Deviation (Population) | 2.9% | 4.6% |
Similar Demographics by Divorced or Separated
Demographics Similar to Natives/Alaskans by Divorced or Separated
In terms of divorced or separated, the demographic groups most similar to Natives/Alaskans are Nicaraguan (13.0%, a difference of 0.050%), Venezuelan (13.0%, a difference of 0.070%), Immigrants from Jamaica (13.0%, a difference of 0.10%), Celtic (13.0%, a difference of 0.47%), and Apache (12.9%, a difference of 0.60%).
| Demographics | Rating | Rank | Divorced or Separated |
| Pima | 0.0 /100 | #290 | Tragic 12.9% |
| Immigrants | Honduras | 0.0 /100 | #291 | Tragic 12.9% |
| Scotch-Irish | 0.0 /100 | #292 | Tragic 12.9% |
| Jamaicans | 0.0 /100 | #293 | Tragic 12.9% |
| Apache | 0.0 /100 | #294 | Tragic 12.9% |
| Celtics | 0.0 /100 | #295 | Tragic 13.0% |
| Nicaraguans | 0.0 /100 | #296 | Tragic 13.0% |
| Natives/Alaskans | 0.0 /100 | #297 | Tragic 13.0% |
| Venezuelans | 0.0 /100 | #298 | Tragic 13.0% |
| Immigrants | Jamaica | 0.0 /100 | #299 | Tragic 13.0% |
| Immigrants | Cabo Verde | 0.0 /100 | #300 | Tragic 13.1% |
| Alaskan Athabascans | 0.0 /100 | #301 | Tragic 13.1% |
| Immigrants | Venezuela | 0.0 /100 | #302 | Tragic 13.1% |
| Cape Verdeans | 0.0 /100 | #303 | Tragic 13.1% |
| Hopi | 0.0 /100 | #304 | Tragic 13.2% |
Demographics Similar to Immigrants from Ireland by Divorced or Separated
In terms of divorced or separated, the demographic groups most similar to Immigrants from Ireland are Mongolian (11.1%, a difference of 0.30%), Tongan (11.1%, a difference of 0.37%), Egyptian (11.1%, a difference of 0.42%), Immigrants from Uzbekistan (11.1%, a difference of 0.49%), and Armenian (11.0%, a difference of 0.52%).
| Demographics | Rating | Rank | Divorced or Separated |
| Immigrants | Pakistan | 100.0 /100 | #23 | Exceptional 10.8% |
| Immigrants | Sri Lanka | 100.0 /100 | #24 | Exceptional 10.8% |
| Iranians | 100.0 /100 | #25 | Exceptional 10.8% |
| Immigrants | Indonesia | 100.0 /100 | #26 | Exceptional 10.9% |
| Immigrants | Bangladesh | 100.0 /100 | #27 | Exceptional 11.0% |
| Immigrants | Malaysia | 100.0 /100 | #28 | Exceptional 11.0% |
| Armenians | 100.0 /100 | #29 | Exceptional 11.0% |
| Immigrants | Ireland | 100.0 /100 | #30 | Exceptional 11.0% |
| Mongolians | 100.0 /100 | #31 | Exceptional 11.1% |
| Tongans | 100.0 /100 | #32 | Exceptional 11.1% |
| Egyptians | 100.0 /100 | #33 | Exceptional 11.1% |
| Immigrants | Uzbekistan | 100.0 /100 | #34 | Exceptional 11.1% |
| Cambodians | 100.0 /100 | #35 | Exceptional 11.1% |
| Immigrants | Japan | 100.0 /100 | #36 | Exceptional 11.1% |
| Immigrants | Lebanon | 100.0 /100 | #37 | Exceptional 11.1% |