Immigrants from Ireland vs Immigrants from Sri Lanka 3 or more Vehicles in Household
COMPARE
Immigrants from Ireland
Immigrants from Sri Lanka
3 or more Vehicles in Household
3 or more Vehicles in Household Comparison
Immigrants from Ireland
Immigrants from Sri Lanka
17.3%
3 OR MORE VEHICLES IN HOUSEHOLD
0.3/ 100
METRIC RATING
282nd/ 347
METRIC RANK
19.2%
3 OR MORE VEHICLES IN HOUSEHOLD
30.7/ 100
METRIC RATING
185th/ 347
METRIC RANK
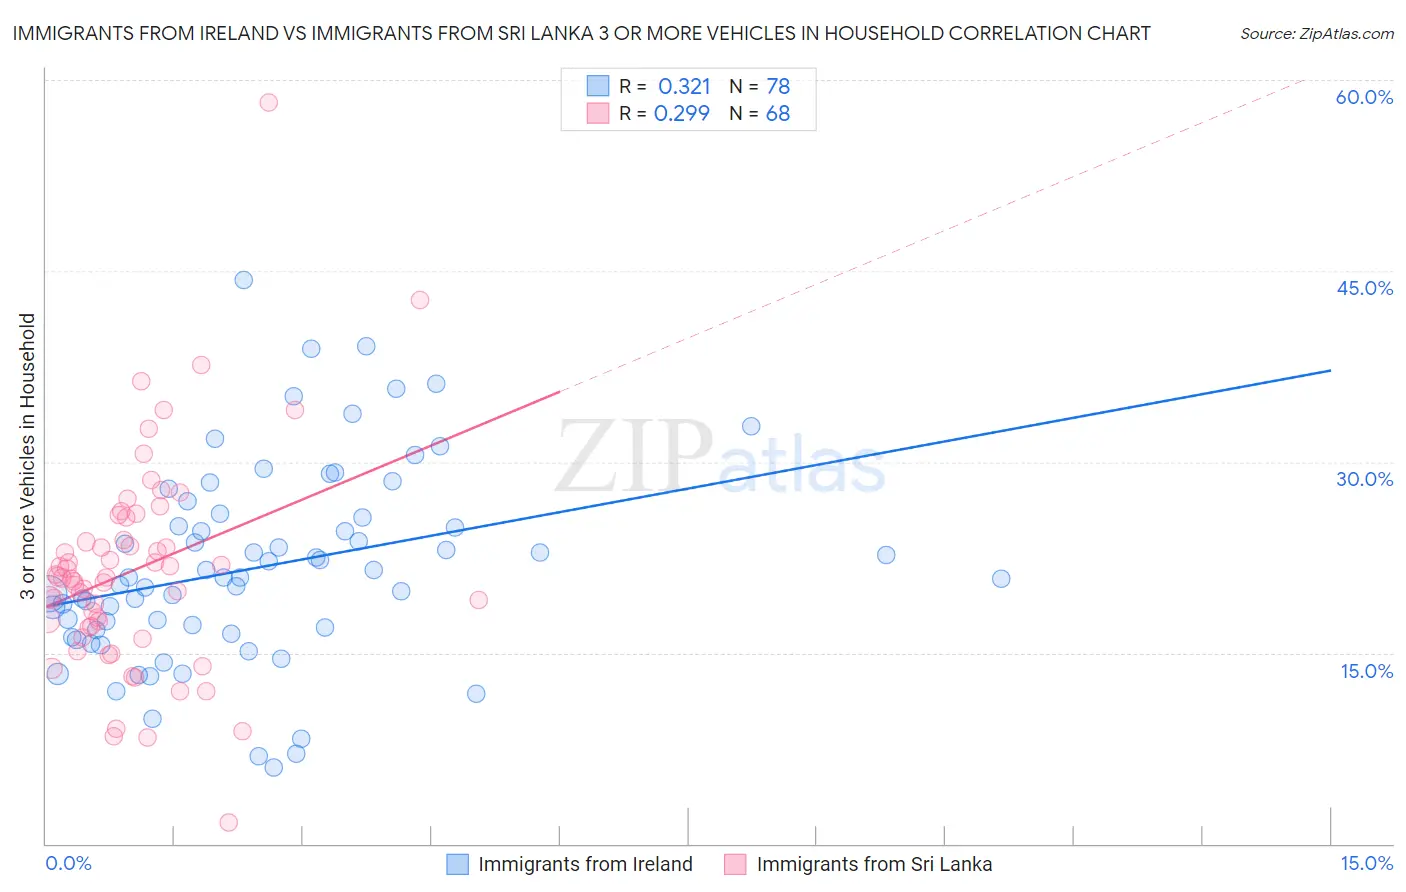
Immigrants from Ireland vs Immigrants from Sri Lanka 3 or more Vehicles in Household Correlation Chart
The statistical analysis conducted on geographies consisting of 240,727,635 people shows a mild positive correlation between the proportion of Immigrants from Ireland and percentage of households with 3 or more vehicles available in the United States with a correlation coefficient (R) of 0.321 and weighted average of 17.3%. Similarly, the statistical analysis conducted on geographies consisting of 149,676,246 people shows a weak positive correlation between the proportion of Immigrants from Sri Lanka and percentage of households with 3 or more vehicles available in the United States with a correlation coefficient (R) of 0.299 and weighted average of 19.2%, a difference of 10.7%.
3 or more Vehicles in Household Correlation Summary
| Measurement | Immigrants from Ireland | Immigrants from Sri Lanka |
| Minimum | 6.0% | 1.7% |
| Maximum | 44.3% | 58.3% |
| Range | 38.3% | 56.6% |
| Mean | 21.7% | 21.5% |
| Median | 20.9% | 20.9% |
| Interquartile 25% (IQ1) | 16.8% | 17.0% |
| Interquartile 75% (IQ3) | 25.6% | 24.8% |
| Interquartile Range (IQR) | 8.8% | 7.7% |
| Standard Deviation (Sample) | 7.8% | 8.6% |
| Standard Deviation (Population) | 7.7% | 8.5% |
Similar Demographics by 3 or more Vehicles in Household
Demographics Similar to Immigrants from Ireland by 3 or more Vehicles in Household
In terms of 3 or more vehicles in household, the demographic groups most similar to Immigrants from Ireland are Black/African American (17.3%, a difference of 0.050%), Immigrants from Colombia (17.3%, a difference of 0.17%), Immigrants from Latvia (17.4%, a difference of 0.29%), Immigrants from Eastern Europe (17.4%, a difference of 0.33%), and Immigrants from Kazakhstan (17.4%, a difference of 0.37%).
| Demographics | Rating | Rank | 3 or more Vehicles in Household |
| Immigrants | Ukraine | 0.4 /100 | #275 | Tragic 17.5% |
| Okinawans | 0.4 /100 | #276 | Tragic 17.4% |
| Brazilians | 0.4 /100 | #277 | Tragic 17.4% |
| Immigrants | Bahamas | 0.3 /100 | #278 | Tragic 17.4% |
| Immigrants | Kazakhstan | 0.3 /100 | #279 | Tragic 17.4% |
| Immigrants | Eastern Europe | 0.3 /100 | #280 | Tragic 17.4% |
| Immigrants | Latvia | 0.3 /100 | #281 | Tragic 17.4% |
| Immigrants | Ireland | 0.3 /100 | #282 | Tragic 17.3% |
| Blacks/African Americans | 0.3 /100 | #283 | Tragic 17.3% |
| Immigrants | Colombia | 0.3 /100 | #284 | Tragic 17.3% |
| Immigrants | Croatia | 0.2 /100 | #285 | Tragic 17.2% |
| Menominee | 0.2 /100 | #286 | Tragic 17.2% |
| Immigrants | Brazil | 0.2 /100 | #287 | Tragic 17.1% |
| Immigrants | Uruguay | 0.2 /100 | #288 | Tragic 17.1% |
| Immigrants | Liberia | 0.1 /100 | #289 | Tragic 17.1% |
Demographics Similar to Immigrants from Sri Lanka by 3 or more Vehicles in Household
In terms of 3 or more vehicles in household, the demographic groups most similar to Immigrants from Sri Lanka are Immigrants from Sweden (19.2%, a difference of 0.16%), Immigrants from Hong Kong (19.2%, a difference of 0.22%), Latvian (19.3%, a difference of 0.44%), Immigrants from Kuwait (19.1%, a difference of 0.44%), and Indian (Asian) (19.1%, a difference of 0.44%).
| Demographics | Rating | Rank | 3 or more Vehicles in Household |
| Immigrants | Syria | 40.3 /100 | #178 | Average 19.4% |
| Immigrants | South Central Asia | 38.9 /100 | #179 | Fair 19.3% |
| South Africans | 37.5 /100 | #180 | Fair 19.3% |
| Romanians | 37.1 /100 | #181 | Fair 19.3% |
| Cubans | 36.6 /100 | #182 | Fair 19.3% |
| Cajuns | 36.0 /100 | #183 | Fair 19.3% |
| Latvians | 35.7 /100 | #184 | Fair 19.3% |
| Immigrants | Sri Lanka | 30.7 /100 | #185 | Fair 19.2% |
| Immigrants | Sweden | 29.0 /100 | #186 | Fair 19.2% |
| Immigrants | Hong Kong | 28.3 /100 | #187 | Fair 19.2% |
| Immigrants | Kuwait | 26.1 /100 | #188 | Fair 19.1% |
| Indians (Asian) | 26.0 /100 | #189 | Fair 19.1% |
| Immigrants | Zimbabwe | 25.5 /100 | #190 | Fair 19.1% |
| South American Indians | 25.4 /100 | #191 | Fair 19.1% |
| Kenyans | 24.7 /100 | #192 | Fair 19.1% |