West Indian vs Delaware 3 or more Vehicles in Household
COMPARE
West Indian
Delaware
3 or more Vehicles in Household
3 or more Vehicles in Household Comparison
West Indians
Delaware
13.7%
3 OR MORE VEHICLES IN HOUSEHOLD
0.0/ 100
METRIC RATING
330th/ 347
METRIC RANK
21.5%
3 OR MORE VEHICLES IN HOUSEHOLD
99.6/ 100
METRIC RATING
86th/ 347
METRIC RANK
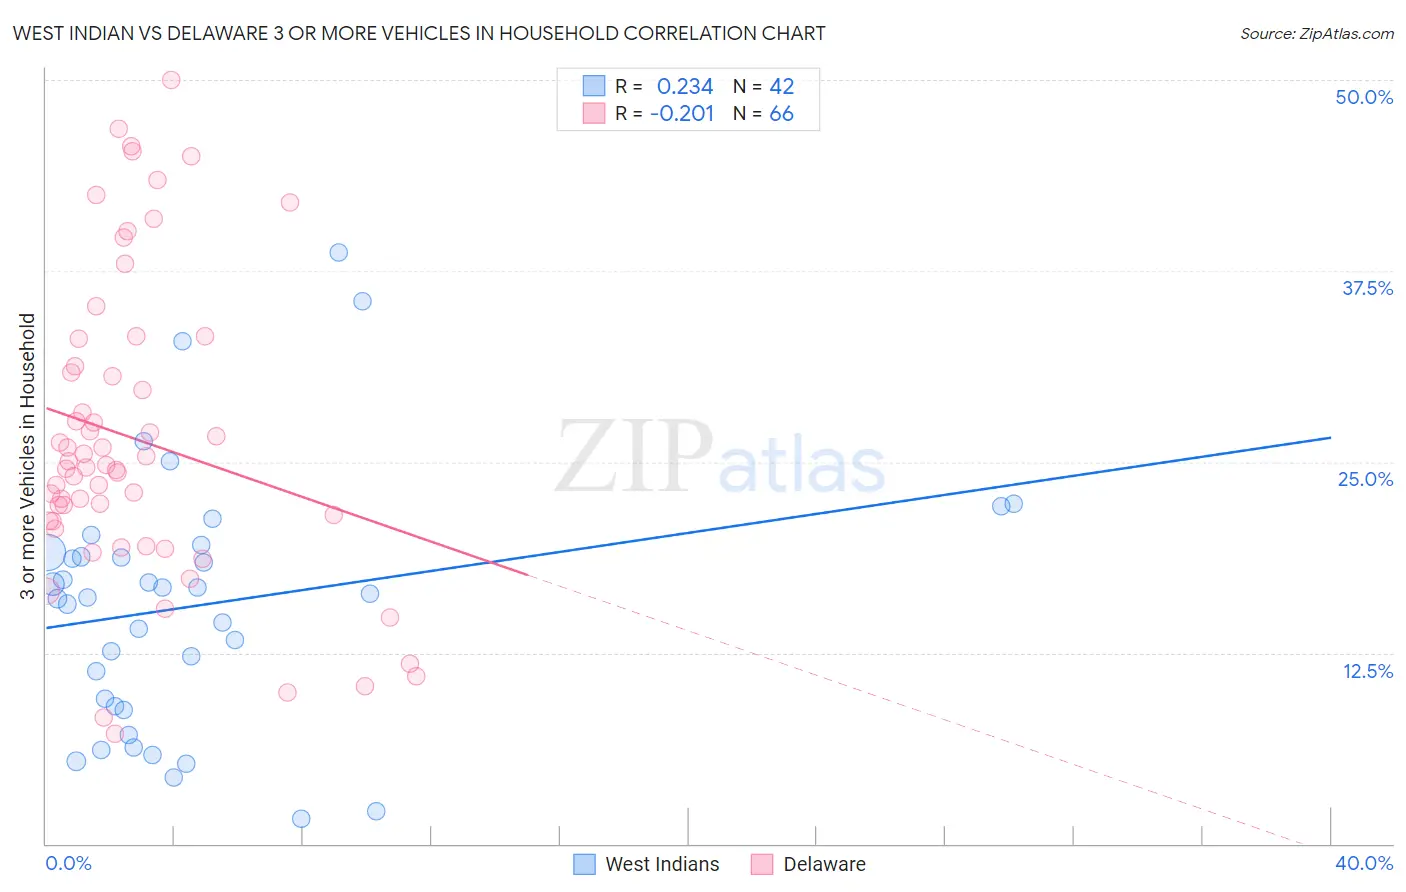
West Indian vs Delaware 3 or more Vehicles in Household Correlation Chart
The statistical analysis conducted on geographies consisting of 253,795,615 people shows a weak positive correlation between the proportion of West Indians and percentage of households with 3 or more vehicles available in the United States with a correlation coefficient (R) of 0.234 and weighted average of 13.7%. Similarly, the statistical analysis conducted on geographies consisting of 96,224,171 people shows a weak negative correlation between the proportion of Delaware and percentage of households with 3 or more vehicles available in the United States with a correlation coefficient (R) of -0.201 and weighted average of 21.5%, a difference of 56.4%.
3 or more Vehicles in Household Correlation Summary
| Measurement | West Indian | Delaware |
| Minimum | 1.7% | 7.2% |
| Maximum | 38.7% | 50.0% |
| Range | 37.0% | 42.8% |
| Mean | 15.6% | 26.5% |
| Median | 16.3% | 24.7% |
| Interquartile 25% (IQ1) | 9.0% | 21.1% |
| Interquartile 75% (IQ3) | 19.1% | 31.3% |
| Interquartile Range (IQR) | 10.1% | 10.1% |
| Standard Deviation (Sample) | 8.4% | 10.0% |
| Standard Deviation (Population) | 8.3% | 9.9% |
Similar Demographics by 3 or more Vehicles in Household
Demographics Similar to West Indians by 3 or more Vehicles in Household
In terms of 3 or more vehicles in household, the demographic groups most similar to West Indians are Immigrants from Dominica (13.7%, a difference of 0.21%), Immigrants from Senegal (13.8%, a difference of 0.33%), Trinidadian and Tobagonian (13.6%, a difference of 0.93%), Immigrants from Cabo Verde (13.6%, a difference of 1.3%), and Immigrants from Albania (14.0%, a difference of 1.5%).
| Demographics | Rating | Rank | 3 or more Vehicles in Household |
| Immigrants | Caribbean | 0.0 /100 | #323 | Tragic 14.6% |
| Immigrants | Yemen | 0.0 /100 | #324 | Tragic 14.2% |
| Senegalese | 0.0 /100 | #325 | Tragic 14.2% |
| Soviet Union | 0.0 /100 | #326 | Tragic 14.2% |
| Ecuadorians | 0.0 /100 | #327 | Tragic 14.1% |
| Immigrants | Albania | 0.0 /100 | #328 | Tragic 14.0% |
| Immigrants | Senegal | 0.0 /100 | #329 | Tragic 13.8% |
| West Indians | 0.0 /100 | #330 | Tragic 13.7% |
| Immigrants | Dominica | 0.0 /100 | #331 | Tragic 13.7% |
| Trinidadians and Tobagonians | 0.0 /100 | #332 | Tragic 13.6% |
| Immigrants | Cabo Verde | 0.0 /100 | #333 | Tragic 13.6% |
| Immigrants | Ecuador | 0.0 /100 | #334 | Tragic 13.4% |
| Immigrants | Trinidad and Tobago | 0.0 /100 | #335 | Tragic 13.3% |
| Barbadians | 0.0 /100 | #336 | Tragic 12.6% |
| Immigrants | Bangladesh | 0.0 /100 | #337 | Tragic 12.5% |
Demographics Similar to Delaware by 3 or more Vehicles in Household
In terms of 3 or more vehicles in household, the demographic groups most similar to Delaware are Laotian (21.5%, a difference of 0.080%), Icelander (21.5%, a difference of 0.090%), Immigrants from the Azores (21.5%, a difference of 0.12%), Chippewa (21.5%, a difference of 0.14%), and Immigrants from El Salvador (21.5%, a difference of 0.17%).
| Demographics | Rating | Rank | 3 or more Vehicles in Household |
| Assyrians/Chaldeans/Syriacs | 99.8 /100 | #79 | Exceptional 21.7% |
| Afghans | 99.7 /100 | #80 | Exceptional 21.7% |
| Celtics | 99.7 /100 | #81 | Exceptional 21.7% |
| Immigrants | El Salvador | 99.6 /100 | #82 | Exceptional 21.5% |
| Chippewa | 99.6 /100 | #83 | Exceptional 21.5% |
| Icelanders | 99.6 /100 | #84 | Exceptional 21.5% |
| Laotians | 99.6 /100 | #85 | Exceptional 21.5% |
| Delaware | 99.6 /100 | #86 | Exceptional 21.5% |
| Immigrants | Azores | 99.5 /100 | #87 | Exceptional 21.5% |
| French | 99.4 /100 | #88 | Exceptional 21.4% |
| Marshallese | 99.2 /100 | #89 | Exceptional 21.3% |
| Immigrants | Afghanistan | 99.1 /100 | #90 | Exceptional 21.2% |
| Belgians | 98.9 /100 | #91 | Exceptional 21.2% |
| Apache | 98.9 /100 | #92 | Exceptional 21.2% |
| Immigrants | Indonesia | 98.8 /100 | #93 | Exceptional 21.1% |