Lithuanian vs Delaware Child Poverty Under the Age of 16
COMPARE
Lithuanian
Delaware
Child Poverty Under the Age of 16
Child Poverty Under the Age of 16 Comparison
Lithuanians
Delaware
13.5%
CHILD POVERTY UNDER THE AGE OF 16
99.6/ 100
METRIC RATING
35th/ 347
METRIC RANK
17.0%
CHILD POVERTY UNDER THE AGE OF 16
17.1/ 100
METRIC RATING
198th/ 347
METRIC RANK
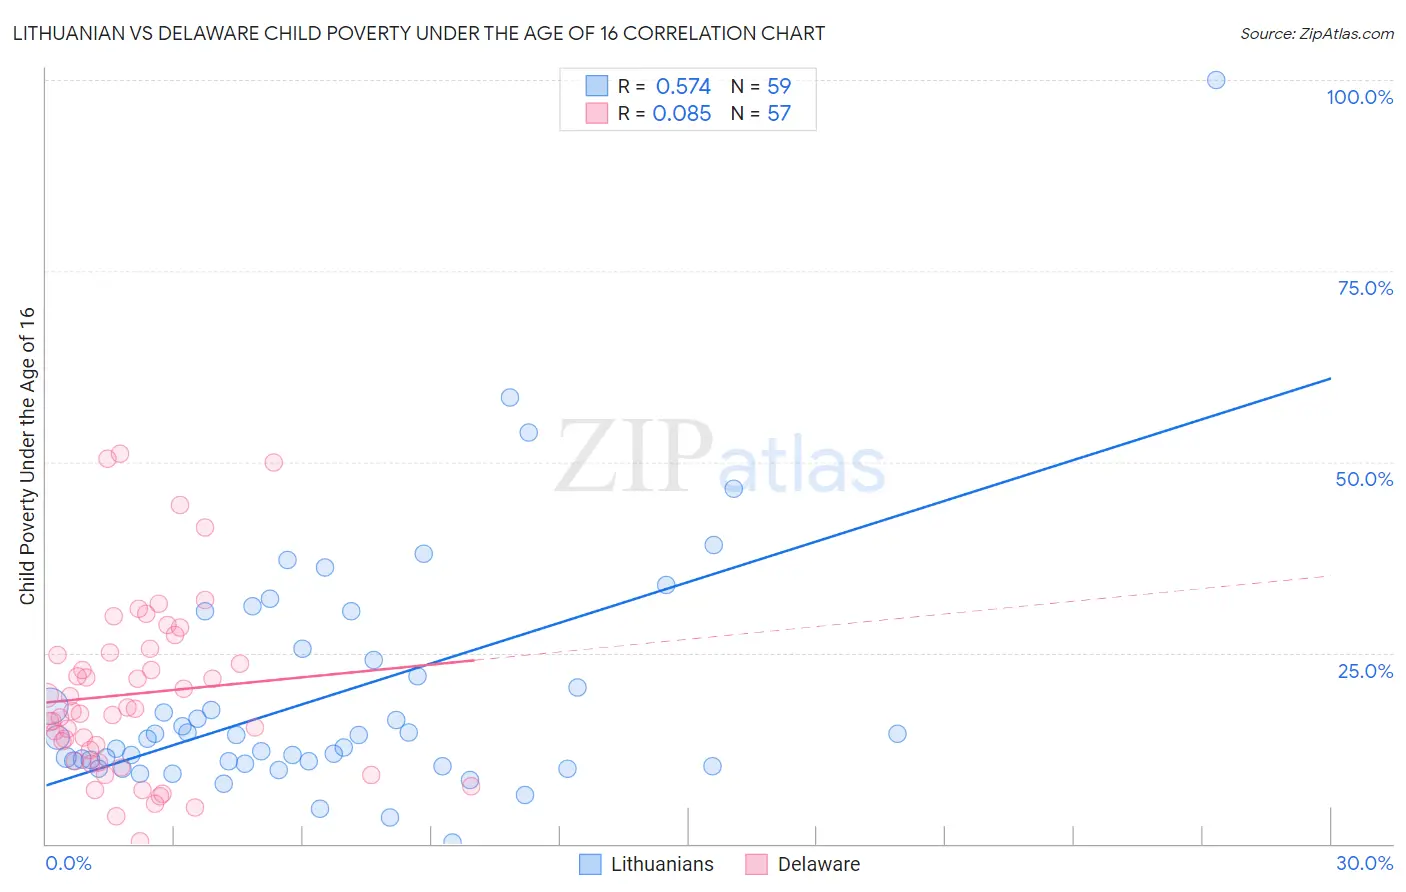
Lithuanian vs Delaware Child Poverty Under the Age of 16 Correlation Chart
The statistical analysis conducted on geographies consisting of 415,877,620 people shows a substantial positive correlation between the proportion of Lithuanians and poverty level among children under the age of 16 in the United States with a correlation coefficient (R) of 0.574 and weighted average of 13.5%. Similarly, the statistical analysis conducted on geographies consisting of 95,926,108 people shows a slight positive correlation between the proportion of Delaware and poverty level among children under the age of 16 in the United States with a correlation coefficient (R) of 0.085 and weighted average of 17.0%, a difference of 25.4%.
Child Poverty Under the Age of 16 Correlation Summary
| Measurement | Lithuanian | Delaware |
| Minimum | 0.17% | 0.33% |
| Maximum | 100.0% | 51.0% |
| Range | 99.8% | 50.7% |
| Mean | 19.4% | 19.7% |
| Median | 13.9% | 17.4% |
| Interquartile 25% (IQ1) | 10.5% | 10.7% |
| Interquartile 75% (IQ3) | 24.0% | 25.3% |
| Interquartile Range (IQR) | 13.4% | 14.6% |
| Standard Deviation (Sample) | 16.2% | 11.7% |
| Standard Deviation (Population) | 16.1% | 11.6% |
Similar Demographics by Child Poverty Under the Age of 16
Demographics Similar to Lithuanians by Child Poverty Under the Age of 16
In terms of child poverty under the age of 16, the demographic groups most similar to Lithuanians are Russian (13.5%, a difference of 0.20%), Immigrants from Northern Europe (13.6%, a difference of 0.24%), Immigrants from Bolivia (13.6%, a difference of 0.26%), Asian (13.5%, a difference of 0.48%), and Luxembourger (13.6%, a difference of 0.77%).
| Demographics | Rating | Rank | Child Poverty Under the Age of 16 |
| Assyrians/Chaldeans/Syriacs | 99.7 /100 | #28 | Exceptional 13.3% |
| Swedes | 99.7 /100 | #29 | Exceptional 13.3% |
| Turks | 99.7 /100 | #30 | Exceptional 13.4% |
| Danes | 99.7 /100 | #31 | Exceptional 13.4% |
| Tongans | 99.7 /100 | #32 | Exceptional 13.4% |
| Asians | 99.6 /100 | #33 | Exceptional 13.5% |
| Russians | 99.6 /100 | #34 | Exceptional 13.5% |
| Lithuanians | 99.6 /100 | #35 | Exceptional 13.5% |
| Immigrants | Northern Europe | 99.6 /100 | #36 | Exceptional 13.6% |
| Immigrants | Bolivia | 99.6 /100 | #37 | Exceptional 13.6% |
| Luxembourgers | 99.5 /100 | #38 | Exceptional 13.6% |
| Immigrants | Australia | 99.5 /100 | #39 | Exceptional 13.6% |
| Immigrants | Scotland | 99.4 /100 | #40 | Exceptional 13.7% |
| Croatians | 99.4 /100 | #41 | Exceptional 13.8% |
| Immigrants | Sri Lanka | 99.3 /100 | #42 | Exceptional 13.8% |
Demographics Similar to Delaware by Child Poverty Under the Age of 16
In terms of child poverty under the age of 16, the demographic groups most similar to Delaware are Immigrants from Kenya (16.9%, a difference of 0.40%), Immigrants from Afghanistan (17.0%, a difference of 0.41%), Immigrants from Cameroon (17.1%, a difference of 0.51%), Immigrants from Uzbekistan (17.1%, a difference of 0.52%), and Ugandan (17.1%, a difference of 0.60%).
| Demographics | Rating | Rank | Child Poverty Under the Age of 16 |
| Immigrants | Iraq | 28.3 /100 | #191 | Fair 16.7% |
| Spanish | 24.5 /100 | #192 | Fair 16.7% |
| Spaniards | 23.2 /100 | #193 | Fair 16.8% |
| Immigrants | Uruguay | 23.1 /100 | #194 | Fair 16.8% |
| Immigrants | Uganda | 22.5 /100 | #195 | Fair 16.8% |
| Immigrants | Lebanon | 22.0 /100 | #196 | Fair 16.8% |
| Immigrants | Kenya | 19.1 /100 | #197 | Poor 16.9% |
| Delaware | 17.1 /100 | #198 | Poor 17.0% |
| Immigrants | Afghanistan | 15.1 /100 | #199 | Poor 17.0% |
| Immigrants | Cameroon | 14.7 /100 | #200 | Poor 17.1% |
| Immigrants | Uzbekistan | 14.7 /100 | #201 | Poor 17.1% |
| Ugandans | 14.3 /100 | #202 | Poor 17.1% |
| Immigrants | Sierra Leone | 14.2 /100 | #203 | Poor 17.1% |
| Hmong | 14.0 /100 | #204 | Poor 17.1% |
| Aleuts | 13.9 /100 | #205 | Poor 17.1% |