Lithuanian vs Delaware Unemployment Among Youth under 25 years
COMPARE
Lithuanian
Delaware
Unemployment Among Youth under 25 years
Unemployment Among Youth under 25 years Comparison
Lithuanians
Delaware
11.3%
UNEMPLOYMENT AMONG YOUTH UNDER 25 YEARS
94.8/ 100
METRIC RATING
94th/ 347
METRIC RANK
12.3%
UNEMPLOYMENT AMONG YOUTH UNDER 25 YEARS
0.4/ 100
METRIC RATING
250th/ 347
METRIC RANK
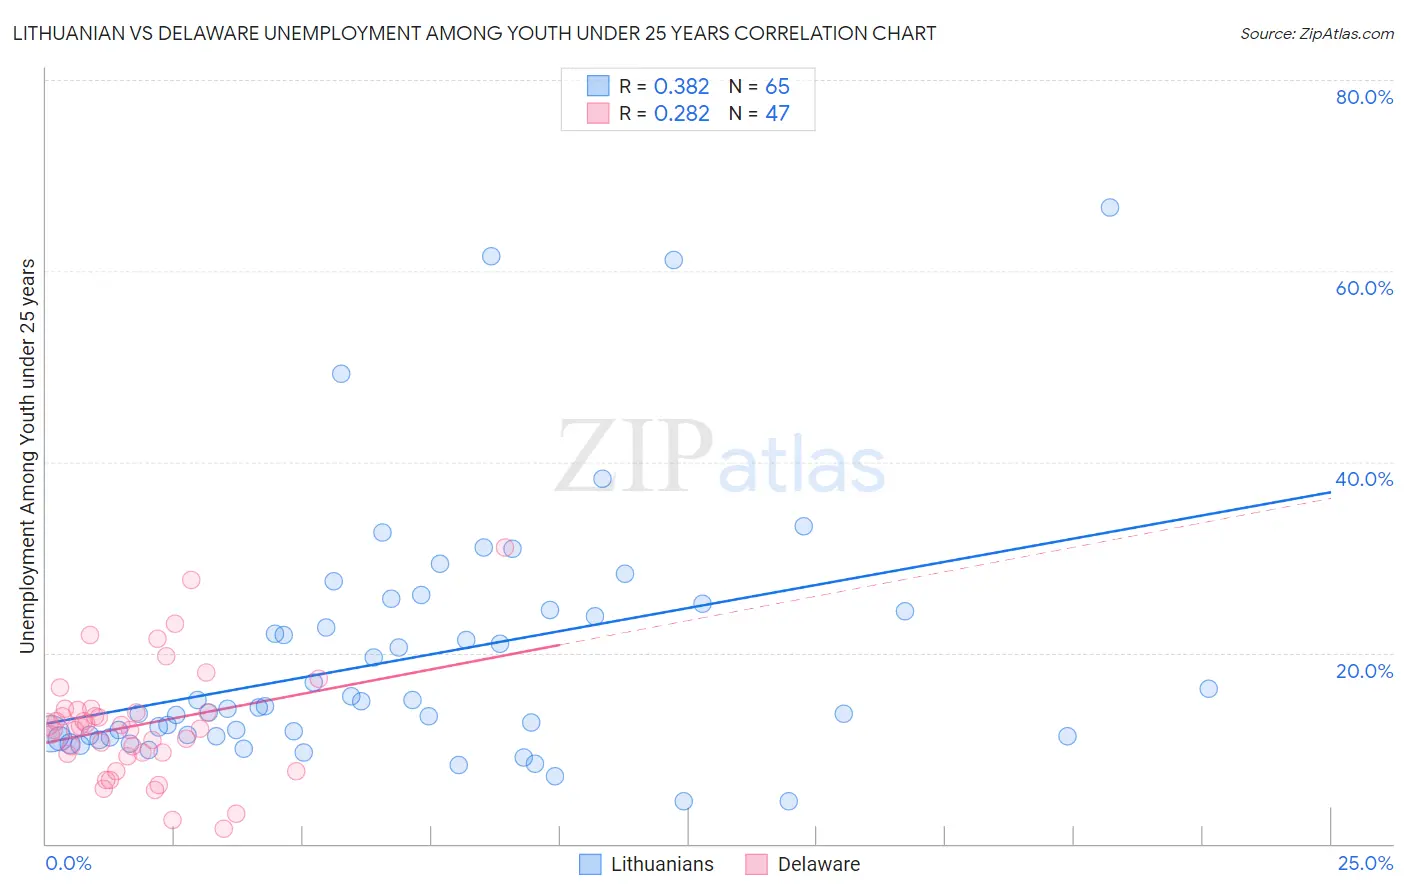
Lithuanian vs Delaware Unemployment Among Youth under 25 years Correlation Chart
The statistical analysis conducted on geographies consisting of 414,177,334 people shows a mild positive correlation between the proportion of Lithuanians and unemployment rate among youth under the age of 25 in the United States with a correlation coefficient (R) of 0.382 and weighted average of 11.3%. Similarly, the statistical analysis conducted on geographies consisting of 95,744,071 people shows a weak positive correlation between the proportion of Delaware and unemployment rate among youth under the age of 25 in the United States with a correlation coefficient (R) of 0.282 and weighted average of 12.3%, a difference of 9.0%.
Unemployment Among Youth under 25 years Correlation Summary
| Measurement | Lithuanian | Delaware |
| Minimum | 4.4% | 1.6% |
| Maximum | 66.6% | 31.0% |
| Range | 62.2% | 29.4% |
| Mean | 19.3% | 12.4% |
| Median | 14.3% | 12.0% |
| Interquartile 25% (IQ1) | 11.2% | 9.4% |
| Interquartile 75% (IQ3) | 24.4% | 14.0% |
| Interquartile Range (IQR) | 13.2% | 4.6% |
| Standard Deviation (Sample) | 13.0% | 5.9% |
| Standard Deviation (Population) | 12.9% | 5.8% |
Similar Demographics by Unemployment Among Youth under 25 years
Demographics Similar to Lithuanians by Unemployment Among Youth under 25 years
In terms of unemployment among youth under 25 years, the demographic groups most similar to Lithuanians are Immigrants from Taiwan (11.2%, a difference of 0.070%), Immigrants from Latvia (11.2%, a difference of 0.070%), Immigrants from North America (11.2%, a difference of 0.070%), Carpatho Rusyn (11.3%, a difference of 0.070%), and Immigrants from Serbia (11.3%, a difference of 0.090%).
| Demographics | Rating | Rank | Unemployment Among Youth under 25 years |
| Kenyans | 95.7 /100 | #87 | Exceptional 11.2% |
| Austrians | 95.5 /100 | #88 | Exceptional 11.2% |
| Immigrants | Japan | 95.5 /100 | #89 | Exceptional 11.2% |
| Immigrants | Bolivia | 95.5 /100 | #90 | Exceptional 11.2% |
| Immigrants | Taiwan | 95.1 /100 | #91 | Exceptional 11.2% |
| Immigrants | Latvia | 95.1 /100 | #92 | Exceptional 11.2% |
| Immigrants | North America | 95.1 /100 | #93 | Exceptional 11.2% |
| Lithuanians | 94.8 /100 | #94 | Exceptional 11.3% |
| Carpatho Rusyns | 94.4 /100 | #95 | Exceptional 11.3% |
| Immigrants | Serbia | 94.4 /100 | #96 | Exceptional 11.3% |
| Nicaraguans | 94.3 /100 | #97 | Exceptional 11.3% |
| Estonians | 94.2 /100 | #98 | Exceptional 11.3% |
| Celtics | 94.0 /100 | #99 | Exceptional 11.3% |
| Pakistanis | 94.0 /100 | #100 | Exceptional 11.3% |
| Iroquois | 93.8 /100 | #101 | Exceptional 11.3% |
Demographics Similar to Delaware by Unemployment Among Youth under 25 years
In terms of unemployment among youth under 25 years, the demographic groups most similar to Delaware are Mexican American Indian (12.3%, a difference of 0.030%), Immigrants from Syria (12.3%, a difference of 0.070%), Mexican (12.3%, a difference of 0.11%), Honduran (12.3%, a difference of 0.13%), and Soviet Union (12.2%, a difference of 0.42%).
| Demographics | Rating | Rank | Unemployment Among Youth under 25 years |
| Immigrants | Azores | 0.6 /100 | #243 | Tragic 12.2% |
| Alaskan Athabascans | 0.6 /100 | #244 | Tragic 12.2% |
| Spanish Americans | 0.6 /100 | #245 | Tragic 12.2% |
| Immigrants | Honduras | 0.6 /100 | #246 | Tragic 12.2% |
| Immigrants | Greece | 0.6 /100 | #247 | Tragic 12.2% |
| Central Americans | 0.6 /100 | #248 | Tragic 12.2% |
| Soviet Union | 0.6 /100 | #249 | Tragic 12.2% |
| Delaware | 0.4 /100 | #250 | Tragic 12.3% |
| Mexican American Indians | 0.4 /100 | #251 | Tragic 12.3% |
| Immigrants | Syria | 0.3 /100 | #252 | Tragic 12.3% |
| Mexicans | 0.3 /100 | #253 | Tragic 12.3% |
| Hondurans | 0.3 /100 | #254 | Tragic 12.3% |
| Hispanics or Latinos | 0.2 /100 | #255 | Tragic 12.4% |
| Liberians | 0.2 /100 | #256 | Tragic 12.4% |
| Panamanians | 0.2 /100 | #257 | Tragic 12.4% |