Italian vs Immigrants from Australia Disability Age 18 to 34

COMPARE

Italian
Race
Ancestry
AfghanAfricanAlaska NativeAlaskan AthabascanAlbanianAleutAlsatianAmericanApacheArabArapahoArgentineanArmenianAssyrian/Chaldean/SyriacAustralianAustrianBahamianBangladeshiBarbadianBasqueBelgianBelizeanBermudanBhutaneseBlackfeetBolivianBrazilianBritishBritish West IndianBulgarianBurmeseCajunCambodianCanadianCape VerdeanCarpatho RusynCelticCentral AmericanCentral American IndianCherokeeCheyenneChickasawChileanChineseChippewaChoctawColombianColvilleComancheCosta RicanCreeCreekCroatianCrowCubanCypriotCzechCzechoslovakianDanishDelawareDominicanDutchDutch West IndianEastern EuropeanEcuadorianEgyptianEnglishEstonianEthiopianEuropeanFijianFilipinoFinnishFrenchFrench American IndianFrench CanadianGermanGerman RussianGhanaianGreekGuamanian/ChamorroGuatemalanGuyaneseHaitianHmongHonduranHopiHoumaHungarianIcelanderIndian (Asian)IndonesianInupiatIranianIraqiIrishIroquoisIsraeliItalianJamaicanJapaneseJordanianKenyanKiowaKoreanLaotianLatvianLebaneseLiberianLithuanianLumbeeLuxembourgerMacedonianMalaysianMalteseMarshalleseMenomineeMexicanMexican American IndianMongolianMoroccanNative HawaiianNavajoNepaleseNew ZealanderNicaraguanNigerianNorthern EuropeanNorwegianOkinawanOsageOttawaPaiutePakistaniPalestinianPanamanianParaguayanPennsylvania GermanPeruvianPimaPolishPortuguesePotawatomiPuebloPuerto RicanPuget Sound SalishRomanianRussianSalvadoranSamoanScandinavianScotch-IrishScottishSeminoleSenegaleseSerbianShoshoneSierra LeoneanSiouxSlavicSlovakSloveneSomaliSouth AfricanSouth AmericanSouth American IndianSoviet UnionSpaniardSpanishSpanish AmericanSpanish American IndianSri LankanSubsaharan AfricanSudaneseSwedishSwissSyrianTaiwaneseThaiTlingit-HaidaTohono O'OdhamTonganTrinidadian and TobagonianTsimshianTurkishU.S. Virgin IslanderUgandanUkrainianUruguayanUteVenezuelanVietnameseWelshWest IndianYakamaYaquiYugoslavianYumanYup'ikZimbabwean
Immigration
NonimmigrantsImmigrantsAfghanistanAfricaAlbaniaArgentinaArmeniaAsiaAustriaBahamasBangladeshBarbadosBelarusBelgiumBelizeBoliviaBosnia and HerzegovinaBrazilBulgariaBurma/MyanmarCabo VerdeCambodiaCameroonCanadaCaribbeanCentral AmericaChileChinaColombiaCongoCosta RicaCroatiaCubaCzechoslovakiaDenmarkDominicaDominican RepublicEastern AfricaEastern AsiaEastern EuropeEcuadorEgyptEl SalvadorEnglandEritreaEthiopiaEuropeFijiFranceGermanyGhanaGreeceGrenadaGuatemalaGuyanaHaitiHondurasHong KongHungaryIndiaIndonesiaIranIraqIrelandIsraelItalyJamaicaJapanJordanKazakhstanKenyaKoreaKuwaitLaosLatin AmericaLatviaLebanonLiberiaLithuaniaMalaysiaMexicoMicronesiaMiddle AfricaMoldovaMoroccoNepalNetherlandsNicaraguaNigeriaNorth AmericaNorth MacedoniaNorthern AfricaNorthern EuropeNorwayOceaniaPakistanPanamaPeruPhilippinesPolandPortugalRomaniaRussiaSaudi ArabiaScotlandSenegalSerbiaSierra LeoneSingaporeSomaliaSouth AfricaSouth AmericaSouth Central AsiaSouth Eastern AsiaSouthern EuropeSpainSri LankaSt. Vincent and the GrenadinesSudanSwedenSwitzerlandSyriaTaiwanThailandTrinidad and TobagoTurkeyUgandaUkraineUruguayUzbekistanVenezuelaVietnamWest IndiesWestern AfricaWestern AsiaWestern EuropeYemenZaireZimbabweAzores
Immigrants from Australia
Race
Ancestry
AfghanAfricanAlaska NativeAlaskan AthabascanAlbanianAleutAlsatianAmericanApacheArabArapahoArgentineanArmenianAssyrian/Chaldean/SyriacAustralianAustrianBahamianBangladeshiBarbadianBasqueBelgianBelizeanBermudanBhutaneseBlackfeetBolivianBrazilianBritishBritish West IndianBulgarianBurmeseCajunCambodianCanadianCape VerdeanCarpatho RusynCelticCentral AmericanCentral American IndianCherokeeCheyenneChickasawChileanChineseChippewaChoctawColombianColvilleComancheCosta RicanCreeCreekCroatianCrowCubanCypriotCzechCzechoslovakianDanishDelawareDominicanDutchDutch West IndianEastern EuropeanEcuadorianEgyptianEnglishEstonianEthiopianEuropeanFijianFilipinoFinnishFrenchFrench American IndianFrench CanadianGermanGerman RussianGhanaianGreekGuamanian/ChamorroGuatemalanGuyaneseHaitianHmongHonduranHopiHoumaHungarianIcelanderIndian (Asian)IndonesianInupiatIranianIraqiIrishIroquoisIsraeliJamaicanJapaneseJordanianKenyanKiowaKoreanLaotianLatvianLebaneseLiberianLithuanianLumbeeLuxembourgerMacedonianMalaysianMalteseMarshalleseMenomineeMexicanMexican American IndianMongolianMoroccanNative HawaiianNavajoNepaleseNew ZealanderNicaraguanNigerianNorthern EuropeanNorwegianOkinawanOsageOttawaPaiutePakistaniPalestinianPanamanianParaguayanPennsylvania GermanPeruvianPimaPolishPortuguesePotawatomiPuebloPuerto RicanPuget Sound SalishRomanianRussianSalvadoranSamoanScandinavianScotch-IrishScottishSeminoleSenegaleseSerbianShoshoneSierra LeoneanSiouxSlavicSlovakSloveneSomaliSouth AfricanSouth AmericanSouth American IndianSoviet UnionSpaniardSpanishSpanish AmericanSpanish American IndianSri LankanSubsaharan AfricanSudaneseSwedishSwissSyrianTaiwaneseThaiTlingit-HaidaTohono O'OdhamTonganTrinidadian and TobagonianTsimshianTurkishU.S. Virgin IslanderUgandanUkrainianUruguayanUteVenezuelanVietnameseWelshWest IndianYakamaYaquiYugoslavianYumanYup'ikZimbabwean
Immigration
NonimmigrantsImmigrantsAfghanistanAfricaAlbaniaArgentinaArmeniaAsiaAustraliaAustriaBahamasBangladeshBarbadosBelarusBelgiumBelizeBoliviaBosnia and HerzegovinaBrazilBulgariaBurma/MyanmarCabo VerdeCambodiaCameroonCanadaCaribbeanCentral AmericaChileChinaColombiaCongoCosta RicaCroatiaCubaCzechoslovakiaDenmarkDominicaDominican RepublicEastern AfricaEastern AsiaEastern EuropeEcuadorEgyptEl SalvadorEnglandEritreaEthiopiaEuropeFijiFranceGermanyGhanaGreeceGrenadaGuatemalaGuyanaHaitiHondurasHong KongHungaryIndiaIndonesiaIranIraqIrelandIsraelItalyJamaicaJapanJordanKazakhstanKenyaKoreaKuwaitLaosLatin AmericaLatviaLebanonLiberiaLithuaniaMalaysiaMexicoMicronesiaMiddle AfricaMoldovaMoroccoNepalNetherlandsNicaraguaNigeriaNorth AmericaNorth MacedoniaNorthern AfricaNorthern EuropeNorwayOceaniaPakistanPanamaPeruPhilippinesPolandPortugalRomaniaRussiaSaudi ArabiaScotlandSenegalSerbiaSierra LeoneSingaporeSomaliaSouth AfricaSouth AmericaSouth Central AsiaSouth Eastern AsiaSouthern EuropeSpainSri LankaSt. Vincent and the GrenadinesSudanSwedenSwitzerlandSyriaTaiwanThailandTrinidad and TobagoTurkeyUgandaUkraineUruguayUzbekistanVenezuelaVietnamWest IndiesWestern AfricaWestern AsiaWestern EuropeYemenZaireZimbabweAzores
Disability Age 18 to 34
Income
Poverty
Unemployment
Labor Participation
Family Structure
Vehicle Availability
Education Level
Disability

Disability Age 18 to 34 Comparison

Italians

Immigrants from Australia

Tragic
Exceptional
7.1%
DISABILITY AGE 18 TO 34
1.2/ 100
METRIC RATING
239th/ 347
METRIC RANK
6.1%
DISABILITY AGE 18 TO 34
98.5/ 100
METRIC RATING
81st/ 347
METRIC RANK

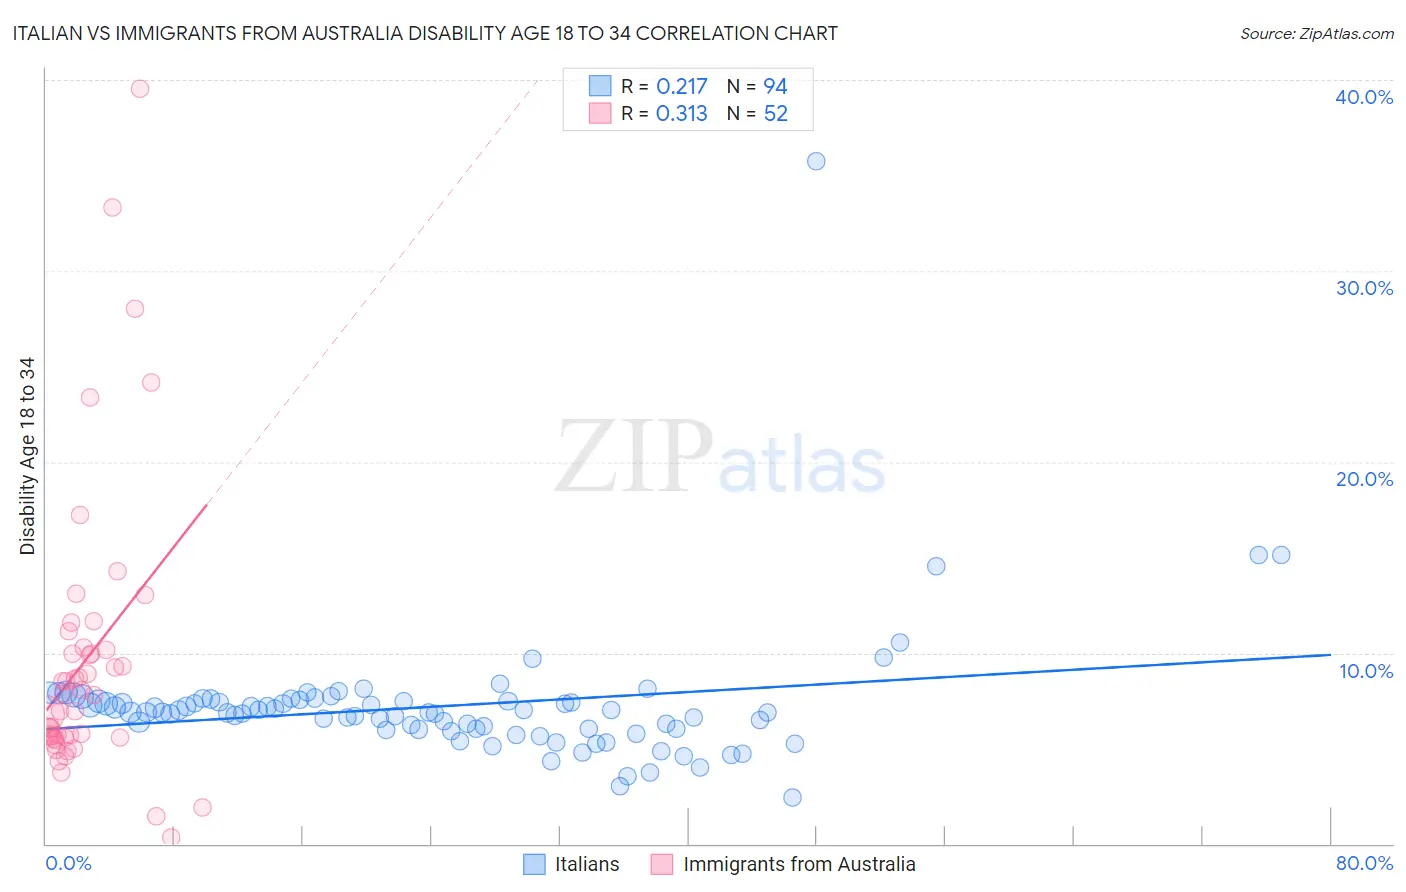
Italian vs Immigrants from Australia Disability Age 18 to 34 Correlation Chart

The statistical analysis conducted on geographies consisting of 568,731,898 people shows a weak positive correlation between the proportion of Italians and percentage of population with a disability between the ages 18 and 35 in the United States with a correlation coefficient (R) of 0.217 and weighted average of 7.1%. Similarly, the statistical analysis conducted on geographies consisting of 226,802,425 people shows a mild positive correlation between the proportion of Immigrants from Australia and percentage of population with a disability between the ages 18 and 35 in the United States with a correlation coefficient (R) of 0.313 and weighted average of 6.1%, a difference of 16.1%.
Italian vs Immigrants from Australia Disability Age 18 to 34

Disability Age 18 to 34 Correlation Summary

MeasurementItalianImmigrants from Australia
Minimum2.5%0.32%
Maximum35.7%39.5%
Range33.3%39.2%
Mean7.2%9.7%
Median6.9%7.8%
Interquartile 25% (IQ1)6.0%5.6%
Interquartile 75% (IQ3)7.5%10.2%
Interquartile Range (IQR)1.5%4.6%
Standard Deviation (Sample)3.6%7.6%
Standard Deviation (Population)3.6%7.5%

Similar Demographics by Disability Age 18 to 34

Demographics Similar to Italians by Disability Age 18 to 34

In terms of disability age 18 to 34, the demographic groups most similar to Italians are Marshallese (7.1%, a difference of 0.12%), Arapaho (7.1%, a difference of 0.12%), Nepalese (7.1%, a difference of 0.12%), Austrian (7.1%, a difference of 0.16%), and Immigrants from Congo (7.1%, a difference of 0.16%).
DemographicsRating | RankDisability Age 18 to 34
Samoans
3.2
/100
|
#232
Tragic
7.0%
New Zealanders
2.7
/100
|
#233
Tragic
7.0%
Alsatians
2.1
/100
|
#234
Tragic
7.0%
Sub-Saharan Africans
1.7
/100
|
#235
Tragic
7.1%
Liberians
1.5
/100
|
#236
Tragic
7.1%
Austrians
1.3
/100
|
#237
Tragic
7.1%
Marshallese
1.3
/100
|
#238
Tragic
7.1%
Italians
1.2
/100
|
#239
Tragic
7.1%
Arapaho
1.1
/100
|
#240
Tragic
7.1%
Nepalese
1.1
/100
|
#241
Tragic
7.1%
Immigrants | Congo
1.1
/100
|
#242
Tragic
7.1%
Icelanders
1.0
/100
|
#243
Tragic
7.1%
Immigrants | Zaire
0.9
/100
|
#244
Tragic
7.1%
Hungarians
0.9
/100
|
#245
Tragic
7.1%
Immigrants | Liberia
0.8
/100
|
#246
Tragic
7.1%

Demographics Similar to Immigrants from Australia by Disability Age 18 to 34

In terms of disability age 18 to 34, the demographic groups most similar to Immigrants from Australia are Immigrants from Chile (6.1%, a difference of 0.040%), Immigrants from Northern Africa (6.1%, a difference of 0.18%), Afghan (6.1%, a difference of 0.24%), Barbadian (6.1%, a difference of 0.25%), and Israeli (6.1%, a difference of 0.28%).
DemographicsRating | RankDisability Age 18 to 34
Haitians
99.2
/100
|
#74
Exceptional
6.0%
Immigrants | Turkey
99.1
/100
|
#75
Exceptional
6.1%
Immigrants | Western Asia
98.9
/100
|
#76
Exceptional
6.1%
Immigrants | Russia
98.9
/100
|
#77
Exceptional
6.1%
Assyrians/Chaldeans/Syriacs
98.9
/100
|
#78
Exceptional
6.1%
Afghans
98.7
/100
|
#79
Exceptional
6.1%
Immigrants | Chile
98.5
/100
|
#80
Exceptional
6.1%
Immigrants | Australia
98.5
/100
|
#81
Exceptional
6.1%
Immigrants | Northern Africa
98.4
/100
|
#82
Exceptional
6.1%
Barbadians
98.3
/100
|
#83
Exceptional
6.1%
Israelis
98.3
/100
|
#84
Exceptional
6.1%
Immigrants | Ireland
98.2
/100
|
#85
Exceptional
6.1%
Immigrants | Kuwait
98.0
/100
|
#86
Exceptional
6.2%
Immigrants | Eastern Europe
97.9
/100
|
#87
Exceptional
6.2%
Cambodians
97.8
/100
|
#88
Exceptional
6.2%