Israeli vs Finnish 3 or more Vehicles in Household
COMPARE
Israeli
Finnish
3 or more Vehicles in Household
3 or more Vehicles in Household Comparison
Israelis
Finns
16.8%
3 OR MORE VEHICLES IN HOUSEHOLD
0.1/ 100
METRIC RATING
297th/ 347
METRIC RANK
22.3%
3 OR MORE VEHICLES IN HOUSEHOLD
99.9/ 100
METRIC RATING
60th/ 347
METRIC RANK
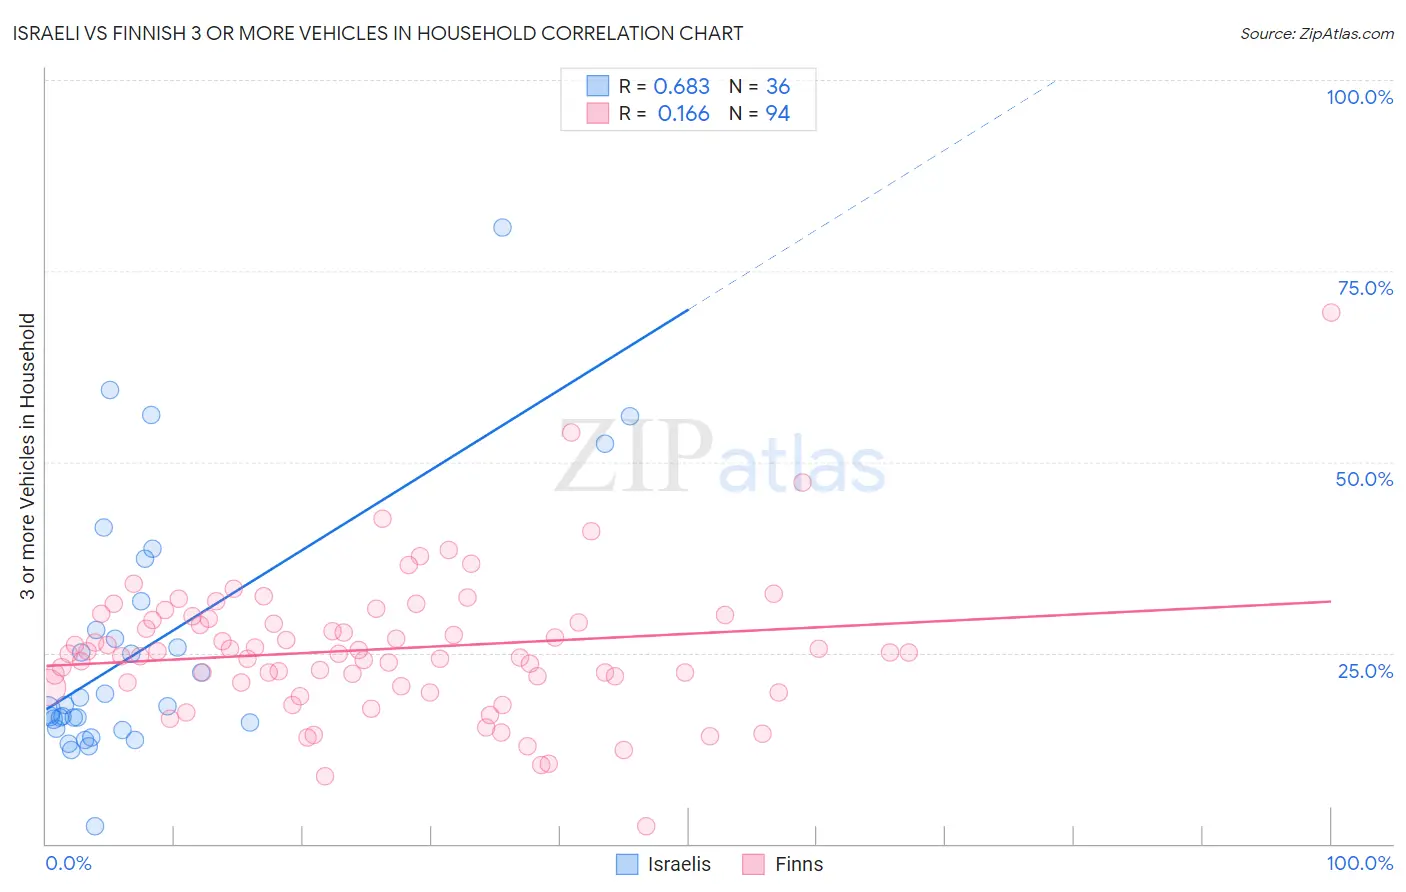
Israeli vs Finnish 3 or more Vehicles in Household Correlation Chart
The statistical analysis conducted on geographies consisting of 210,927,283 people shows a significant positive correlation between the proportion of Israelis and percentage of households with 3 or more vehicles available in the United States with a correlation coefficient (R) of 0.683 and weighted average of 16.8%. Similarly, the statistical analysis conducted on geographies consisting of 404,442,168 people shows a poor positive correlation between the proportion of Finns and percentage of households with 3 or more vehicles available in the United States with a correlation coefficient (R) of 0.166 and weighted average of 22.3%, a difference of 32.8%.
3 or more Vehicles in Household Correlation Summary
| Measurement | Israeli | Finnish |
| Minimum | 2.3% | 2.2% |
| Maximum | 80.8% | 69.6% |
| Range | 78.4% | 67.4% |
| Mean | 25.7% | 25.5% |
| Median | 18.1% | 25.0% |
| Interquartile 25% (IQ1) | 15.5% | 21.1% |
| Interquartile 75% (IQ3) | 29.9% | 29.4% |
| Interquartile Range (IQR) | 14.4% | 8.3% |
| Standard Deviation (Sample) | 16.8% | 9.3% |
| Standard Deviation (Population) | 16.6% | 9.2% |
Similar Demographics by 3 or more Vehicles in Household
Demographics Similar to Israelis by 3 or more Vehicles in Household
In terms of 3 or more vehicles in household, the demographic groups most similar to Israelis are Immigrants from Zaire (16.7%, a difference of 0.37%), Immigrants from South America (16.7%, a difference of 0.43%), Inupiat (16.9%, a difference of 0.47%), Immigrants from Russia (16.9%, a difference of 0.83%), and Immigrants from Western Africa (16.9%, a difference of 0.88%).
| Demographics | Rating | Rank | 3 or more Vehicles in Household |
| Liberians | 0.1 /100 | #290 | Tragic 17.0% |
| Immigrants | Congo | 0.1 /100 | #291 | Tragic 17.0% |
| Immigrants | Spain | 0.1 /100 | #292 | Tragic 17.0% |
| Bahamians | 0.1 /100 | #293 | Tragic 16.9% |
| Immigrants | Western Africa | 0.1 /100 | #294 | Tragic 16.9% |
| Immigrants | Russia | 0.1 /100 | #295 | Tragic 16.9% |
| Inupiat | 0.1 /100 | #296 | Tragic 16.9% |
| Israelis | 0.1 /100 | #297 | Tragic 16.8% |
| Immigrants | Zaire | 0.1 /100 | #298 | Tragic 16.7% |
| Immigrants | South America | 0.1 /100 | #299 | Tragic 16.7% |
| Cypriots | 0.0 /100 | #300 | Tragic 16.6% |
| Paraguayans | 0.0 /100 | #301 | Tragic 16.6% |
| Immigrants | Greece | 0.0 /100 | #302 | Tragic 16.5% |
| Immigrants | Serbia | 0.0 /100 | #303 | Tragic 16.4% |
| Ghanaians | 0.0 /100 | #304 | Tragic 16.4% |
Demographics Similar to Finns by 3 or more Vehicles in Household
In terms of 3 or more vehicles in household, the demographic groups most similar to Finns are Navajo (22.3%, a difference of 0.090%), Spaniard (22.3%, a difference of 0.15%), Bhutanese (22.2%, a difference of 0.16%), Fijian (22.2%, a difference of 0.20%), and Pennsylvania German (22.3%, a difference of 0.28%).
| Demographics | Rating | Rank | 3 or more Vehicles in Household |
| Czechs | 100.0 /100 | #53 | Exceptional 22.5% |
| Crow | 100.0 /100 | #54 | Exceptional 22.5% |
| Immigrants | Laos | 100.0 /100 | #55 | Exceptional 22.4% |
| Hispanics or Latinos | 100.0 /100 | #56 | Exceptional 22.4% |
| Pennsylvania Germans | 100.0 /100 | #57 | Exceptional 22.3% |
| Spaniards | 100.0 /100 | #58 | Exceptional 22.3% |
| Navajo | 100.0 /100 | #59 | Exceptional 22.3% |
| Finns | 99.9 /100 | #60 | Exceptional 22.3% |
| Bhutanese | 99.9 /100 | #61 | Exceptional 22.2% |
| Fijians | 99.9 /100 | #62 | Exceptional 22.2% |
| Chickasaw | 99.9 /100 | #63 | Exceptional 22.2% |
| Immigrants | Taiwan | 99.9 /100 | #64 | Exceptional 22.1% |
| Pima | 99.9 /100 | #65 | Exceptional 22.0% |
| Northern Europeans | 99.9 /100 | #66 | Exceptional 22.0% |
| Alaskan Athabascans | 99.9 /100 | #67 | Exceptional 21.9% |