Israeli vs Immigrants from Cameroon Hearing Disability
COMPARE
Israeli
Immigrants from Cameroon
Hearing Disability
Hearing Disability Comparison
Israelis
Immigrants from Cameroon
2.8%
HEARING DISABILITY
95.9/ 100
METRIC RATING
95th/ 347
METRIC RANK
2.6%
HEARING DISABILITY
99.7/ 100
METRIC RATING
31st/ 347
METRIC RANK
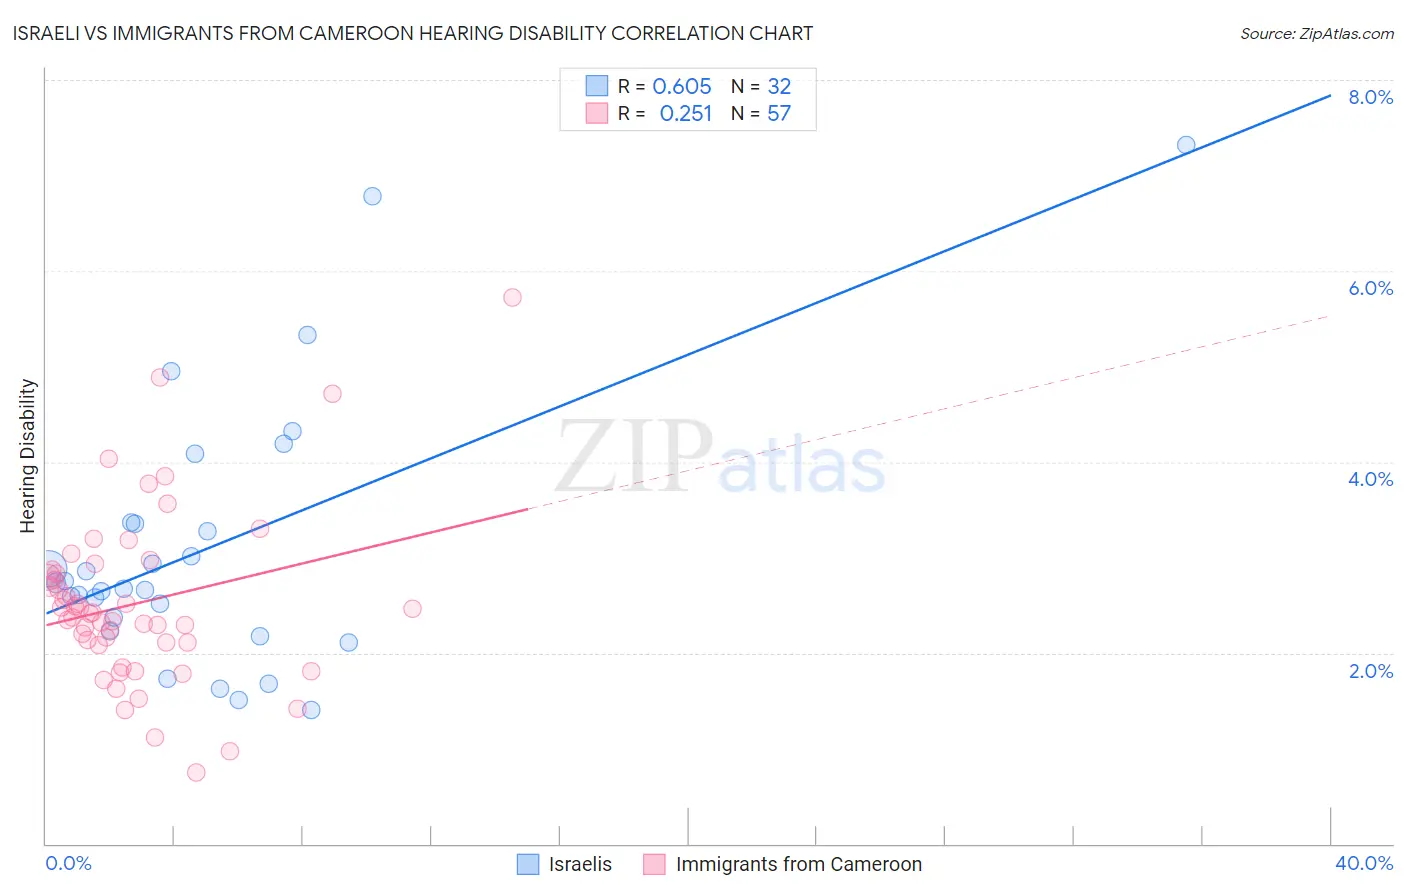
Israeli vs Immigrants from Cameroon Hearing Disability Correlation Chart
The statistical analysis conducted on geographies consisting of 211,123,306 people shows a significant positive correlation between the proportion of Israelis and percentage of population with hearing disability in the United States with a correlation coefficient (R) of 0.605 and weighted average of 2.8%. Similarly, the statistical analysis conducted on geographies consisting of 130,730,708 people shows a weak positive correlation between the proportion of Immigrants from Cameroon and percentage of population with hearing disability in the United States with a correlation coefficient (R) of 0.251 and weighted average of 2.6%, a difference of 7.0%.
Hearing Disability Correlation Summary
| Measurement | Israeli | Immigrants from Cameroon |
| Minimum | 1.4% | 0.75% |
| Maximum | 7.3% | 5.7% |
| Range | 5.9% | 5.0% |
| Mean | 3.1% | 2.5% |
| Median | 2.7% | 2.4% |
| Interquartile 25% (IQ1) | 2.3% | 2.1% |
| Interquartile 75% (IQ3) | 3.4% | 2.8% |
| Interquartile Range (IQR) | 1.1% | 0.75% |
| Standard Deviation (Sample) | 1.4% | 0.91% |
| Standard Deviation (Population) | 1.4% | 0.90% |
Similar Demographics by Hearing Disability
Demographics Similar to Israelis by Hearing Disability
In terms of hearing disability, the demographic groups most similar to Israelis are Uruguayan (2.8%, a difference of 0.020%), Immigrants from Somalia (2.8%, a difference of 0.19%), Immigrants from Kuwait (2.8%, a difference of 0.29%), Immigrants from Afghanistan (2.8%, a difference of 0.36%), and Iranian (2.8%, a difference of 0.41%).
| Demographics | Rating | Rank | Hearing Disability |
| Immigrants | Turkey | 96.7 /100 | #88 | Exceptional 2.8% |
| Belizeans | 96.6 /100 | #89 | Exceptional 2.8% |
| Immigrants | Morocco | 96.6 /100 | #90 | Exceptional 2.8% |
| Immigrants | Middle Africa | 96.5 /100 | #91 | Exceptional 2.8% |
| Iranians | 96.4 /100 | #92 | Exceptional 2.8% |
| Immigrants | Kuwait | 96.3 /100 | #93 | Exceptional 2.8% |
| Uruguayans | 95.9 /100 | #94 | Exceptional 2.8% |
| Israelis | 95.9 /100 | #95 | Exceptional 2.8% |
| Immigrants | Somalia | 95.5 /100 | #96 | Exceptional 2.8% |
| Immigrants | Afghanistan | 95.3 /100 | #97 | Exceptional 2.8% |
| Immigrants | Honduras | 95.1 /100 | #98 | Exceptional 2.8% |
| Immigrants | Guatemala | 95.1 /100 | #99 | Exceptional 2.8% |
| Immigrants | Eastern Africa | 95.0 /100 | #100 | Exceptional 2.8% |
| Immigrants | Spain | 94.9 /100 | #101 | Exceptional 2.8% |
| Taiwanese | 94.8 /100 | #102 | Exceptional 2.8% |
Demographics Similar to Immigrants from Cameroon by Hearing Disability
In terms of hearing disability, the demographic groups most similar to Immigrants from Cameroon are Immigrants from Caribbean (2.6%, a difference of 0.010%), Bolivian (2.6%, a difference of 0.090%), Immigrants from Haiti (2.6%, a difference of 0.11%), Immigrants from Venezuela (2.6%, a difference of 0.14%), and Filipino (2.6%, a difference of 0.40%).
| Demographics | Rating | Rank | Hearing Disability |
| Immigrants | Ghana | 99.8 /100 | #24 | Exceptional 2.6% |
| Immigrants | El Salvador | 99.7 /100 | #25 | Exceptional 2.6% |
| Immigrants | Senegal | 99.7 /100 | #26 | Exceptional 2.6% |
| Immigrants | South Central Asia | 99.7 /100 | #27 | Exceptional 2.6% |
| Immigrants | Haiti | 99.7 /100 | #28 | Exceptional 2.6% |
| Bolivians | 99.7 /100 | #29 | Exceptional 2.6% |
| Immigrants | Caribbean | 99.7 /100 | #30 | Exceptional 2.6% |
| Immigrants | Cameroon | 99.7 /100 | #31 | Exceptional 2.6% |
| Immigrants | Venezuela | 99.7 /100 | #32 | Exceptional 2.6% |
| Filipinos | 99.6 /100 | #33 | Exceptional 2.6% |
| Immigrants | Pakistan | 99.6 /100 | #34 | Exceptional 2.6% |
| Salvadorans | 99.6 /100 | #35 | Exceptional 2.6% |
| Okinawans | 99.6 /100 | #36 | Exceptional 2.6% |
| Immigrants | Western Africa | 99.6 /100 | #37 | Exceptional 2.6% |
| Immigrants | Jamaica | 99.5 /100 | #38 | Exceptional 2.6% |