Thai vs Immigrants from Cabo Verde 4 or more Vehicles in Household
COMPARE
Thai
Immigrants from Cabo Verde
4 or more Vehicles in Household
4 or more Vehicles in Household Comparison
Thais
Immigrants from Cabo Verde
6.2%
4 OR MORE VEHICLES IN HOUSEHOLD
36.9/ 100
METRIC RATING
185th/ 347
METRIC RANK
3.8%
4 OR MORE VEHICLES IN HOUSEHOLD
0.0/ 100
METRIC RATING
338th/ 347
METRIC RANK
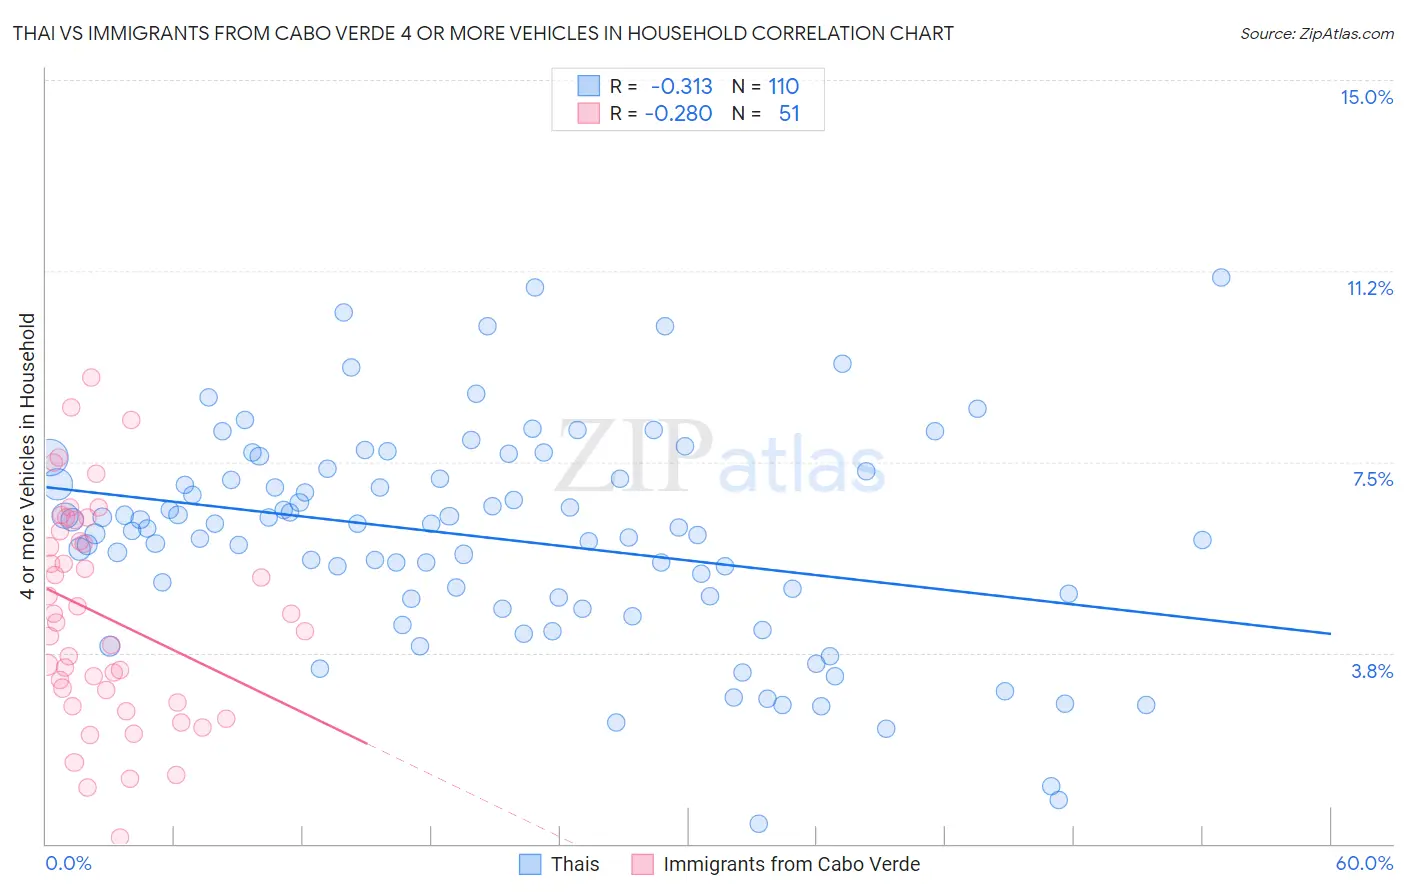
Thai vs Immigrants from Cabo Verde 4 or more Vehicles in Household Correlation Chart
The statistical analysis conducted on geographies consisting of 473,279,987 people shows a mild negative correlation between the proportion of Thais and percentage of households with 4 or more vehicles available in the United States with a correlation coefficient (R) of -0.313 and weighted average of 6.2%. Similarly, the statistical analysis conducted on geographies consisting of 38,088,471 people shows a weak negative correlation between the proportion of Immigrants from Cabo Verde and percentage of households with 4 or more vehicles available in the United States with a correlation coefficient (R) of -0.280 and weighted average of 3.8%, a difference of 63.8%.
4 or more Vehicles in Household Correlation Summary
| Measurement | Thai | Immigrants from Cabo Verde |
| Minimum | 0.38% | 0.12% |
| Maximum | 11.1% | 9.2% |
| Range | 10.7% | 9.0% |
| Mean | 6.0% | 4.5% |
| Median | 6.2% | 4.3% |
| Interquartile 25% (IQ1) | 4.8% | 2.8% |
| Interquartile 75% (IQ3) | 7.2% | 6.1% |
| Interquartile Range (IQR) | 2.3% | 3.4% |
| Standard Deviation (Sample) | 2.1% | 2.1% |
| Standard Deviation (Population) | 2.1% | 2.1% |
Similar Demographics by 4 or more Vehicles in Household
Demographics Similar to Thais by 4 or more Vehicles in Household
In terms of 4 or more vehicles in household, the demographic groups most similar to Thais are Immigrants from Northern Europe (6.2%, a difference of 0.020%), Iraqi (6.2%, a difference of 0.040%), Immigrants from Burma/Myanmar (6.2%, a difference of 0.060%), Immigrants from South Africa (6.2%, a difference of 0.17%), and Kiowa (6.2%, a difference of 0.25%).
| Demographics | Rating | Rank | 4 or more Vehicles in Household |
| Belizeans | 44.5 /100 | #178 | Average 6.3% |
| Immigrants | Japan | 43.1 /100 | #179 | Average 6.3% |
| Syrians | 42.0 /100 | #180 | Average 6.3% |
| Yugoslavians | 41.1 /100 | #181 | Average 6.3% |
| South American Indians | 40.7 /100 | #182 | Average 6.3% |
| Immigrants | Burma/Myanmar | 37.5 /100 | #183 | Fair 6.2% |
| Iraqis | 37.3 /100 | #184 | Fair 6.2% |
| Thais | 36.9 /100 | #185 | Fair 6.2% |
| Immigrants | Northern Europe | 36.8 /100 | #186 | Fair 6.2% |
| Immigrants | South Africa | 35.4 /100 | #187 | Fair 6.2% |
| Kiowa | 34.7 /100 | #188 | Fair 6.2% |
| Immigrants | Eastern Asia | 33.3 /100 | #189 | Fair 6.2% |
| South Africans | 32.2 /100 | #190 | Fair 6.2% |
| Inupiat | 30.7 /100 | #191 | Fair 6.2% |
| Romanians | 30.7 /100 | #192 | Fair 6.2% |
Demographics Similar to Immigrants from Cabo Verde by 4 or more Vehicles in Household
In terms of 4 or more vehicles in household, the demographic groups most similar to Immigrants from Cabo Verde are Vietnamese (3.9%, a difference of 1.8%), Immigrants from Bangladesh (3.9%, a difference of 2.4%), Barbadian (3.9%, a difference of 2.5%), Immigrants from Uzbekistan (3.6%, a difference of 5.0%), and Immigrants from Barbados (3.6%, a difference of 5.6%).
| Demographics | Rating | Rank | 4 or more Vehicles in Household |
| West Indians | 0.0 /100 | #331 | Tragic 4.2% |
| Immigrants | Dominica | 0.0 /100 | #332 | Tragic 4.2% |
| Immigrants | Albania | 0.0 /100 | #333 | Tragic 4.1% |
| Immigrants | Trinidad and Tobago | 0.0 /100 | #334 | Tragic 4.1% |
| Barbadians | 0.0 /100 | #335 | Tragic 3.9% |
| Immigrants | Bangladesh | 0.0 /100 | #336 | Tragic 3.9% |
| Vietnamese | 0.0 /100 | #337 | Tragic 3.9% |
| Immigrants | Cabo Verde | 0.0 /100 | #338 | Tragic 3.8% |
| Immigrants | Uzbekistan | 0.0 /100 | #339 | Tragic 3.6% |
| Immigrants | Barbados | 0.0 /100 | #340 | Tragic 3.6% |
| Dominicans | 0.0 /100 | #341 | Tragic 3.5% |
| Guyanese | 0.0 /100 | #342 | Tragic 3.5% |
| British West Indians | 0.0 /100 | #343 | Tragic 3.5% |
| Immigrants | Guyana | 0.0 /100 | #344 | Tragic 3.4% |
| Immigrants | Dominican Republic | 0.0 /100 | #345 | Tragic 3.3% |