Immigrants from Korea vs Immigrants from Cabo Verde 4 or more Vehicles in Household
COMPARE
Immigrants from Korea
Immigrants from Cabo Verde
4 or more Vehicles in Household
4 or more Vehicles in Household Comparison
Immigrants from Korea
Immigrants from Cabo Verde
6.8%
4 OR MORE VEHICLES IN HOUSEHOLD
93.8/ 100
METRIC RATING
127th/ 347
METRIC RANK
3.8%
4 OR MORE VEHICLES IN HOUSEHOLD
0.0/ 100
METRIC RATING
338th/ 347
METRIC RANK
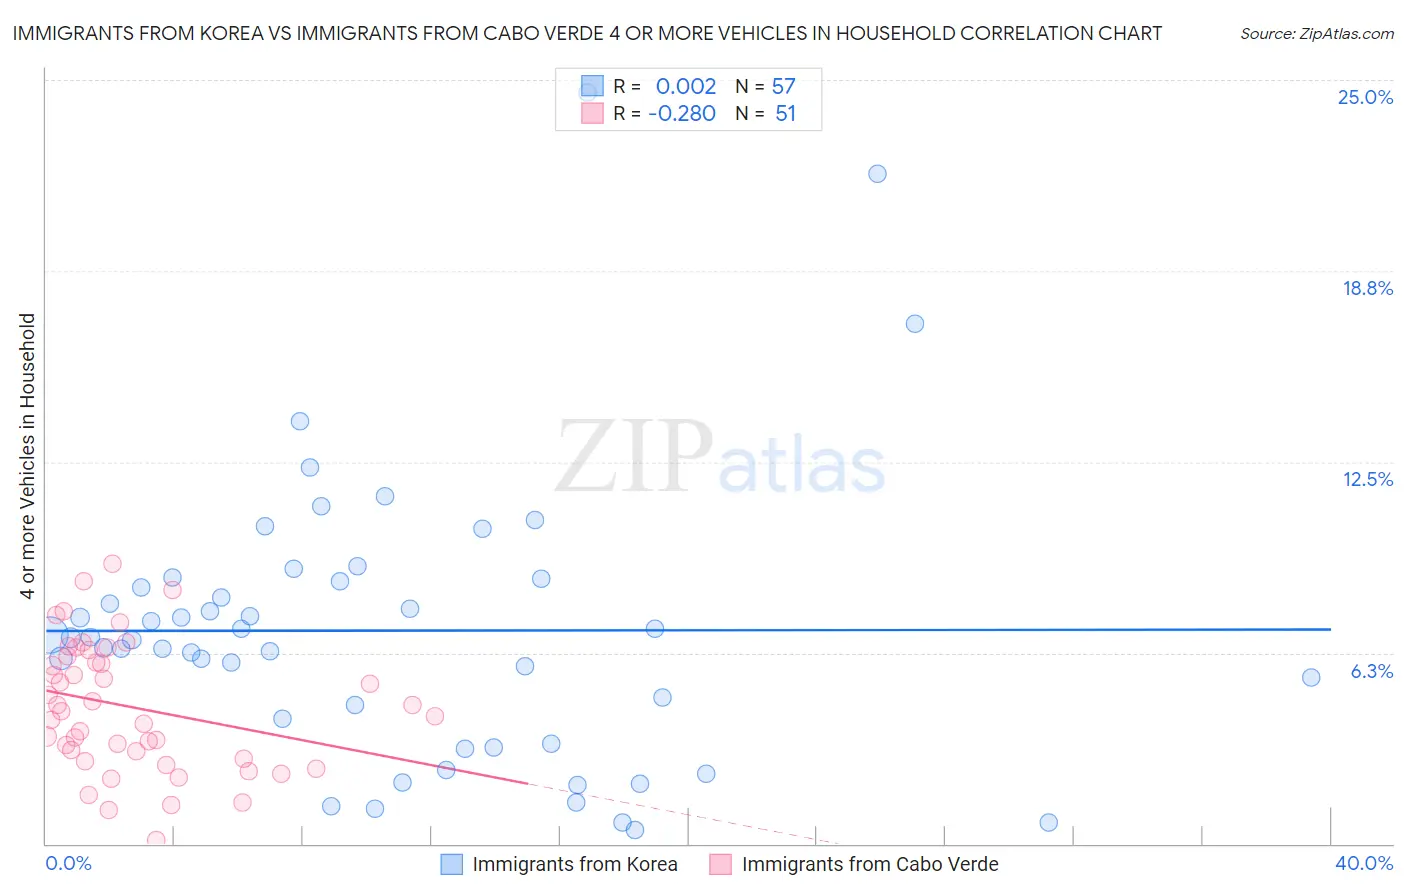
Immigrants from Korea vs Immigrants from Cabo Verde 4 or more Vehicles in Household Correlation Chart
The statistical analysis conducted on geographies consisting of 414,077,591 people shows no correlation between the proportion of Immigrants from Korea and percentage of households with 4 or more vehicles available in the United States with a correlation coefficient (R) of 0.002 and weighted average of 6.8%. Similarly, the statistical analysis conducted on geographies consisting of 38,088,471 people shows a weak negative correlation between the proportion of Immigrants from Cabo Verde and percentage of households with 4 or more vehicles available in the United States with a correlation coefficient (R) of -0.280 and weighted average of 3.8%, a difference of 77.5%.
4 or more Vehicles in Household Correlation Summary
| Measurement | Immigrants from Korea | Immigrants from Cabo Verde |
| Minimum | 0.44% | 0.12% |
| Maximum | 24.6% | 9.2% |
| Range | 24.1% | 9.0% |
| Mean | 7.0% | 4.5% |
| Median | 6.7% | 4.3% |
| Interquartile 25% (IQ1) | 3.7% | 2.8% |
| Interquartile 75% (IQ3) | 8.6% | 6.1% |
| Interquartile Range (IQR) | 5.0% | 3.4% |
| Standard Deviation (Sample) | 4.7% | 2.1% |
| Standard Deviation (Population) | 4.6% | 2.1% |
Similar Demographics by 4 or more Vehicles in Household
Demographics Similar to Immigrants from Korea by 4 or more Vehicles in Household
In terms of 4 or more vehicles in household, the demographic groups most similar to Immigrants from Korea are Belgian (6.8%, a difference of 0.12%), Austrian (6.8%, a difference of 0.13%), Immigrants from Asia (6.8%, a difference of 0.23%), Immigrants (6.8%, a difference of 0.33%), and Immigrants from Germany (6.8%, a difference of 0.39%).
| Demographics | Rating | Rank | 4 or more Vehicles in Household |
| Comanche | 94.8 /100 | #120 | Exceptional 6.8% |
| Immigrants | Germany | 94.7 /100 | #121 | Exceptional 6.8% |
| Immigrants | Nicaragua | 94.7 /100 | #122 | Exceptional 6.8% |
| Immigrants | Immigrants | 94.6 /100 | #123 | Exceptional 6.8% |
| Immigrants | Asia | 94.4 /100 | #124 | Exceptional 6.8% |
| Austrians | 94.1 /100 | #125 | Exceptional 6.8% |
| Belgians | 94.1 /100 | #126 | Exceptional 6.8% |
| Immigrants | Korea | 93.8 /100 | #127 | Exceptional 6.8% |
| Immigrants | Bolivia | 92.5 /100 | #128 | Exceptional 6.7% |
| Immigrants | England | 92.0 /100 | #129 | Exceptional 6.7% |
| Immigrants | Scotland | 89.0 /100 | #130 | Excellent 6.7% |
| Maltese | 88.4 /100 | #131 | Excellent 6.7% |
| Immigrants | Netherlands | 87.8 /100 | #132 | Excellent 6.6% |
| Armenians | 86.9 /100 | #133 | Excellent 6.6% |
| Ottawa | 86.9 /100 | #134 | Excellent 6.6% |
Demographics Similar to Immigrants from Cabo Verde by 4 or more Vehicles in Household
In terms of 4 or more vehicles in household, the demographic groups most similar to Immigrants from Cabo Verde are Vietnamese (3.9%, a difference of 1.8%), Immigrants from Bangladesh (3.9%, a difference of 2.4%), Barbadian (3.9%, a difference of 2.5%), Immigrants from Uzbekistan (3.6%, a difference of 5.0%), and Immigrants from Barbados (3.6%, a difference of 5.6%).
| Demographics | Rating | Rank | 4 or more Vehicles in Household |
| West Indians | 0.0 /100 | #331 | Tragic 4.2% |
| Immigrants | Dominica | 0.0 /100 | #332 | Tragic 4.2% |
| Immigrants | Albania | 0.0 /100 | #333 | Tragic 4.1% |
| Immigrants | Trinidad and Tobago | 0.0 /100 | #334 | Tragic 4.1% |
| Barbadians | 0.0 /100 | #335 | Tragic 3.9% |
| Immigrants | Bangladesh | 0.0 /100 | #336 | Tragic 3.9% |
| Vietnamese | 0.0 /100 | #337 | Tragic 3.9% |
| Immigrants | Cabo Verde | 0.0 /100 | #338 | Tragic 3.8% |
| Immigrants | Uzbekistan | 0.0 /100 | #339 | Tragic 3.6% |
| Immigrants | Barbados | 0.0 /100 | #340 | Tragic 3.6% |
| Dominicans | 0.0 /100 | #341 | Tragic 3.5% |
| Guyanese | 0.0 /100 | #342 | Tragic 3.5% |
| British West Indians | 0.0 /100 | #343 | Tragic 3.5% |
| Immigrants | Guyana | 0.0 /100 | #344 | Tragic 3.4% |
| Immigrants | Dominican Republic | 0.0 /100 | #345 | Tragic 3.3% |