Nicaraguan vs Immigrants from Cabo Verde 4 or more Vehicles in Household
COMPARE
Nicaraguan
Immigrants from Cabo Verde
4 or more Vehicles in Household
4 or more Vehicles in Household Comparison
Nicaraguans
Immigrants from Cabo Verde
7.0%
4 OR MORE VEHICLES IN HOUSEHOLD
98.0/ 100
METRIC RATING
107th/ 347
METRIC RANK
3.8%
4 OR MORE VEHICLES IN HOUSEHOLD
0.0/ 100
METRIC RATING
338th/ 347
METRIC RANK
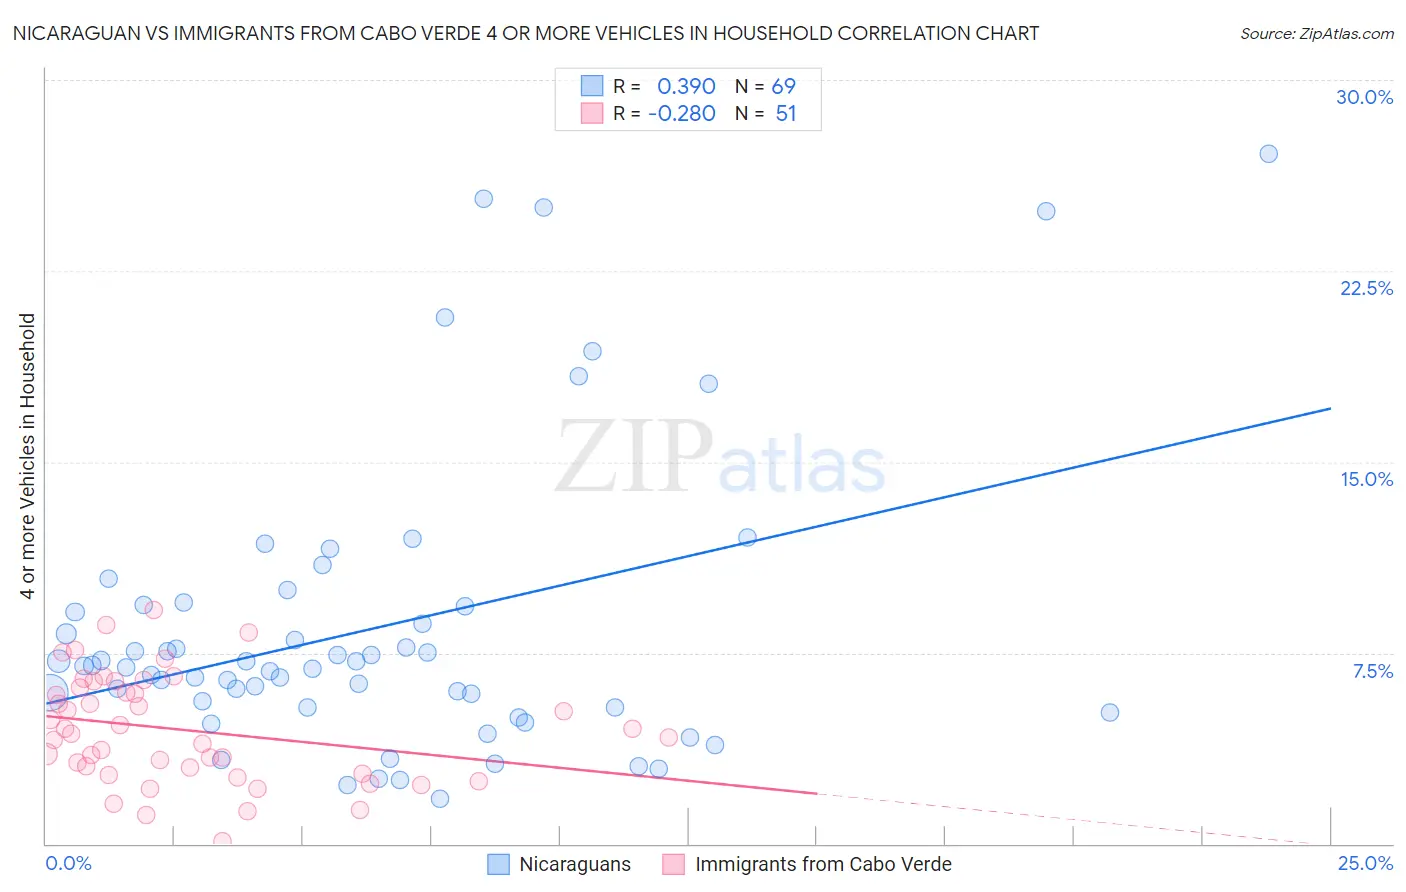
Nicaraguan vs Immigrants from Cabo Verde 4 or more Vehicles in Household Correlation Chart
The statistical analysis conducted on geographies consisting of 284,526,626 people shows a mild positive correlation between the proportion of Nicaraguans and percentage of households with 4 or more vehicles available in the United States with a correlation coefficient (R) of 0.390 and weighted average of 7.0%. Similarly, the statistical analysis conducted on geographies consisting of 38,088,471 people shows a weak negative correlation between the proportion of Immigrants from Cabo Verde and percentage of households with 4 or more vehicles available in the United States with a correlation coefficient (R) of -0.280 and weighted average of 3.8%, a difference of 82.6%.
4 or more Vehicles in Household Correlation Summary
| Measurement | Nicaraguan | Immigrants from Cabo Verde |
| Minimum | 1.8% | 0.12% |
| Maximum | 27.1% | 9.2% |
| Range | 25.3% | 9.0% |
| Mean | 8.5% | 4.5% |
| Median | 7.0% | 4.3% |
| Interquartile 25% (IQ1) | 5.3% | 2.8% |
| Interquartile 75% (IQ3) | 9.4% | 6.1% |
| Interquartile Range (IQR) | 4.0% | 3.4% |
| Standard Deviation (Sample) | 5.7% | 2.1% |
| Standard Deviation (Population) | 5.7% | 2.1% |
Similar Demographics by 4 or more Vehicles in Household
Demographics Similar to Nicaraguans by 4 or more Vehicles in Household
In terms of 4 or more vehicles in household, the demographic groups most similar to Nicaraguans are Guatemalan (7.0%, a difference of 0.010%), French (6.9%, a difference of 0.34%), Hmong (7.0%, a difference of 0.36%), German Russian (7.0%, a difference of 0.36%), and Filipino (6.9%, a difference of 0.52%).
| Demographics | Rating | Rank | 4 or more Vehicles in Household |
| Taiwanese | 98.7 /100 | #100 | Exceptional 7.0% |
| Pakistanis | 98.7 /100 | #101 | Exceptional 7.0% |
| Asians | 98.6 /100 | #102 | Exceptional 7.0% |
| Blackfeet | 98.6 /100 | #103 | Exceptional 7.0% |
| Hmong | 98.3 /100 | #104 | Exceptional 7.0% |
| German Russians | 98.3 /100 | #105 | Exceptional 7.0% |
| Guatemalans | 98.1 /100 | #106 | Exceptional 7.0% |
| Nicaraguans | 98.0 /100 | #107 | Exceptional 7.0% |
| French | 97.7 /100 | #108 | Exceptional 6.9% |
| Filipinos | 97.6 /100 | #109 | Exceptional 6.9% |
| Immigrants | Thailand | 97.0 /100 | #110 | Exceptional 6.9% |
| Aleuts | 97.0 /100 | #111 | Exceptional 6.9% |
| Hopi | 97.0 /100 | #112 | Exceptional 6.9% |
| Canadians | 96.4 /100 | #113 | Exceptional 6.9% |
| Bolivians | 96.3 /100 | #114 | Exceptional 6.8% |
Demographics Similar to Immigrants from Cabo Verde by 4 or more Vehicles in Household
In terms of 4 or more vehicles in household, the demographic groups most similar to Immigrants from Cabo Verde are Vietnamese (3.9%, a difference of 1.8%), Immigrants from Bangladesh (3.9%, a difference of 2.4%), Barbadian (3.9%, a difference of 2.5%), Immigrants from Uzbekistan (3.6%, a difference of 5.0%), and Immigrants from Barbados (3.6%, a difference of 5.6%).
| Demographics | Rating | Rank | 4 or more Vehicles in Household |
| West Indians | 0.0 /100 | #331 | Tragic 4.2% |
| Immigrants | Dominica | 0.0 /100 | #332 | Tragic 4.2% |
| Immigrants | Albania | 0.0 /100 | #333 | Tragic 4.1% |
| Immigrants | Trinidad and Tobago | 0.0 /100 | #334 | Tragic 4.1% |
| Barbadians | 0.0 /100 | #335 | Tragic 3.9% |
| Immigrants | Bangladesh | 0.0 /100 | #336 | Tragic 3.9% |
| Vietnamese | 0.0 /100 | #337 | Tragic 3.9% |
| Immigrants | Cabo Verde | 0.0 /100 | #338 | Tragic 3.8% |
| Immigrants | Uzbekistan | 0.0 /100 | #339 | Tragic 3.6% |
| Immigrants | Barbados | 0.0 /100 | #340 | Tragic 3.6% |
| Dominicans | 0.0 /100 | #341 | Tragic 3.5% |
| Guyanese | 0.0 /100 | #342 | Tragic 3.5% |
| British West Indians | 0.0 /100 | #343 | Tragic 3.5% |
| Immigrants | Guyana | 0.0 /100 | #344 | Tragic 3.4% |
| Immigrants | Dominican Republic | 0.0 /100 | #345 | Tragic 3.3% |