Immigrants from Zaire vs Assyrian/Chaldean/Syriac Female Disability
COMPARE
Immigrants from Zaire
Assyrian/Chaldean/Syriac
Female Disability
Female Disability Comparison
Immigrants from Zaire
Assyrians/Chaldeans/Syriacs
12.3%
FEMALE DISABILITY
20.9/ 100
METRIC RATING
204th/ 347
METRIC RANK
12.5%
FEMALE DISABILITY
8.0/ 100
METRIC RATING
227th/ 347
METRIC RANK
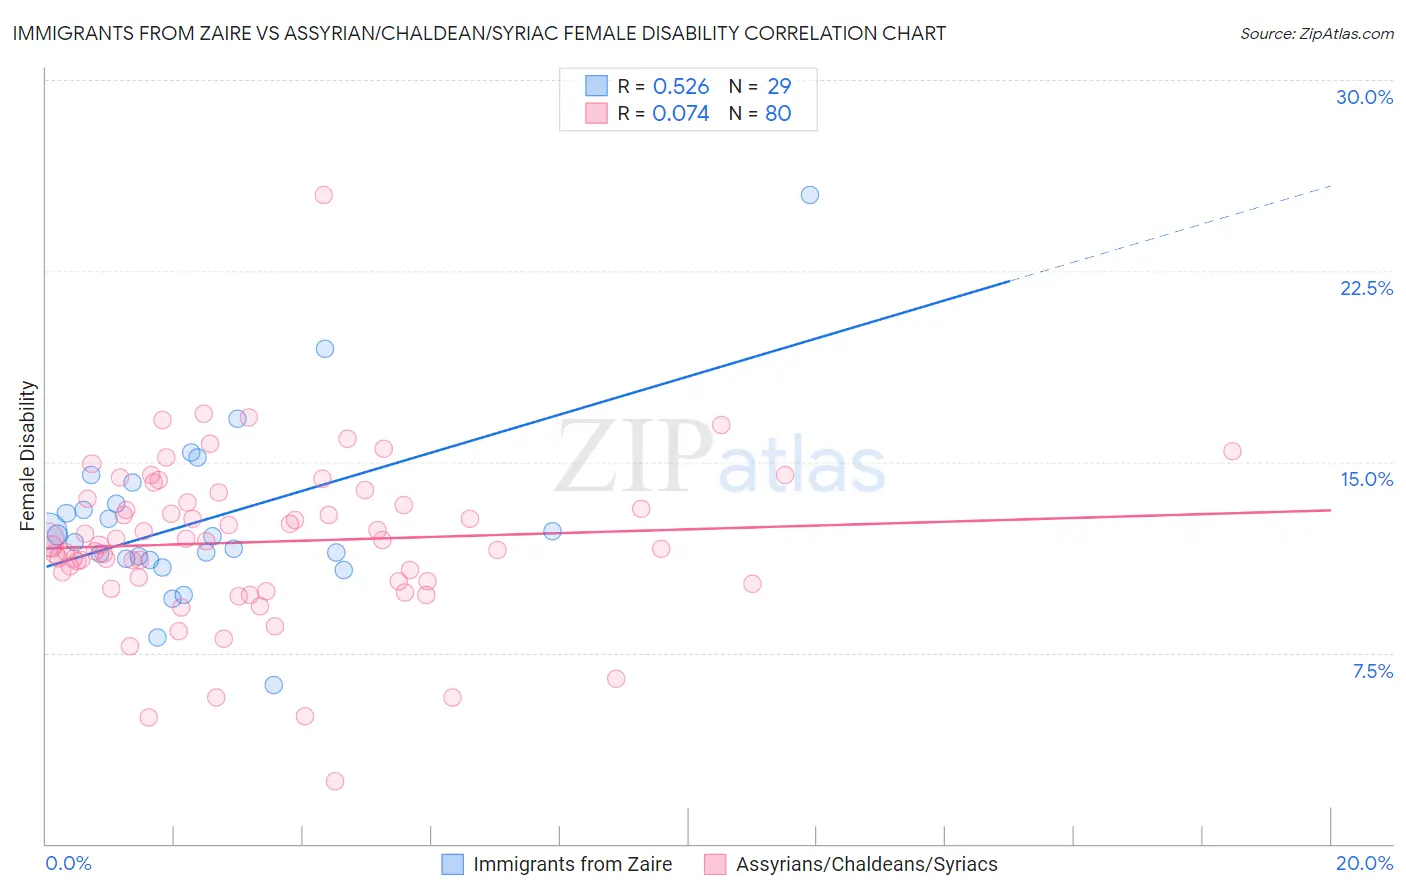
Immigrants from Zaire vs Assyrian/Chaldean/Syriac Female Disability Correlation Chart
The statistical analysis conducted on geographies consisting of 107,254,316 people shows a substantial positive correlation between the proportion of Immigrants from Zaire and percentage of females with a disability in the United States with a correlation coefficient (R) of 0.526 and weighted average of 12.3%. Similarly, the statistical analysis conducted on geographies consisting of 110,312,508 people shows a slight positive correlation between the proportion of Assyrians/Chaldeans/Syriacs and percentage of females with a disability in the United States with a correlation coefficient (R) of 0.074 and weighted average of 12.5%, a difference of 1.0%.
Female Disability Correlation Summary
| Measurement | Immigrants from Zaire | Assyrian/Chaldean/Syriac |
| Minimum | 6.2% | 2.4% |
| Maximum | 25.5% | 25.5% |
| Range | 19.3% | 23.0% |
| Mean | 12.7% | 11.9% |
| Median | 12.1% | 11.8% |
| Interquartile 25% (IQ1) | 11.2% | 10.3% |
| Interquartile 75% (IQ3) | 13.8% | 13.5% |
| Interquartile Range (IQR) | 2.6% | 3.1% |
| Standard Deviation (Sample) | 3.5% | 3.2% |
| Standard Deviation (Population) | 3.5% | 3.2% |
Similar Demographics by Female Disability
Demographics Similar to Immigrants from Zaire by Female Disability
In terms of female disability, the demographic groups most similar to Immigrants from Zaire are Immigrants from Barbados (12.3%, a difference of 0.020%), Immigrants from Grenada (12.4%, a difference of 0.020%), Somali (12.3%, a difference of 0.040%), Immigrants from Cuba (12.4%, a difference of 0.040%), and Croatian (12.4%, a difference of 0.040%).
| Demographics | Rating | Rank | Female Disability |
| Hondurans | 25.4 /100 | #197 | Fair 12.3% |
| Mexican American Indians | 24.9 /100 | #198 | Fair 12.3% |
| Immigrants | Trinidad and Tobago | 24.7 /100 | #199 | Fair 12.3% |
| Trinidadians and Tobagonians | 22.4 /100 | #200 | Fair 12.3% |
| Chinese | 22.1 /100 | #201 | Fair 12.3% |
| Somalis | 21.5 /100 | #202 | Fair 12.3% |
| Immigrants | Barbados | 21.1 /100 | #203 | Fair 12.3% |
| Immigrants | Zaire | 20.9 /100 | #204 | Fair 12.3% |
| Immigrants | Grenada | 20.5 /100 | #205 | Fair 12.4% |
| Immigrants | Cuba | 20.2 /100 | #206 | Fair 12.4% |
| Croatians | 20.2 /100 | #207 | Fair 12.4% |
| Basques | 17.5 /100 | #208 | Poor 12.4% |
| Mexicans | 15.7 /100 | #209 | Poor 12.4% |
| Swiss | 14.9 /100 | #210 | Poor 12.4% |
| Immigrants | Bosnia and Herzegovina | 14.8 /100 | #211 | Poor 12.4% |
Demographics Similar to Assyrians/Chaldeans/Syriacs by Female Disability
In terms of female disability, the demographic groups most similar to Assyrians/Chaldeans/Syriacs are Hispanic or Latino (12.5%, a difference of 0.010%), Immigrants from Cambodia (12.5%, a difference of 0.030%), Polish (12.5%, a difference of 0.060%), Hungarian (12.5%, a difference of 0.10%), and Immigrants from Belize (12.5%, a difference of 0.13%).
| Demographics | Rating | Rank | Female Disability |
| Bahamians | 11.1 /100 | #220 | Poor 12.4% |
| Native Hawaiians | 10.8 /100 | #221 | Poor 12.4% |
| Italians | 10.7 /100 | #222 | Poor 12.4% |
| Guamanians/Chamorros | 9.5 /100 | #223 | Tragic 12.5% |
| Belizeans | 9.3 /100 | #224 | Tragic 12.5% |
| Poles | 8.4 /100 | #225 | Tragic 12.5% |
| Hispanics or Latinos | 8.0 /100 | #226 | Tragic 12.5% |
| Assyrians/Chaldeans/Syriacs | 8.0 /100 | #227 | Tragic 12.5% |
| Immigrants | Cambodia | 7.8 /100 | #228 | Tragic 12.5% |
| Hungarians | 7.2 /100 | #229 | Tragic 12.5% |
| Immigrants | Belize | 7.0 /100 | #230 | Tragic 12.5% |
| Belgians | 6.5 /100 | #231 | Tragic 12.5% |
| Immigrants | Somalia | 5.9 /100 | #232 | Tragic 12.5% |
| Immigrants | Iraq | 5.3 /100 | #233 | Tragic 12.5% |
| Scandinavians | 5.3 /100 | #234 | Tragic 12.5% |