Immigrants from Italy vs Assyrian/Chaldean/Syriac 3 or more Vehicles in Household
COMPARE
Immigrants from Italy
Assyrian/Chaldean/Syriac
3 or more Vehicles in Household
3 or more Vehicles in Household Comparison
Immigrants from Italy
Assyrians/Chaldeans/Syriacs
18.7%
3 OR MORE VEHICLES IN HOUSEHOLD
10.2/ 100
METRIC RATING
217th/ 347
METRIC RANK
21.7%
3 OR MORE VEHICLES IN HOUSEHOLD
99.8/ 100
METRIC RATING
79th/ 347
METRIC RANK
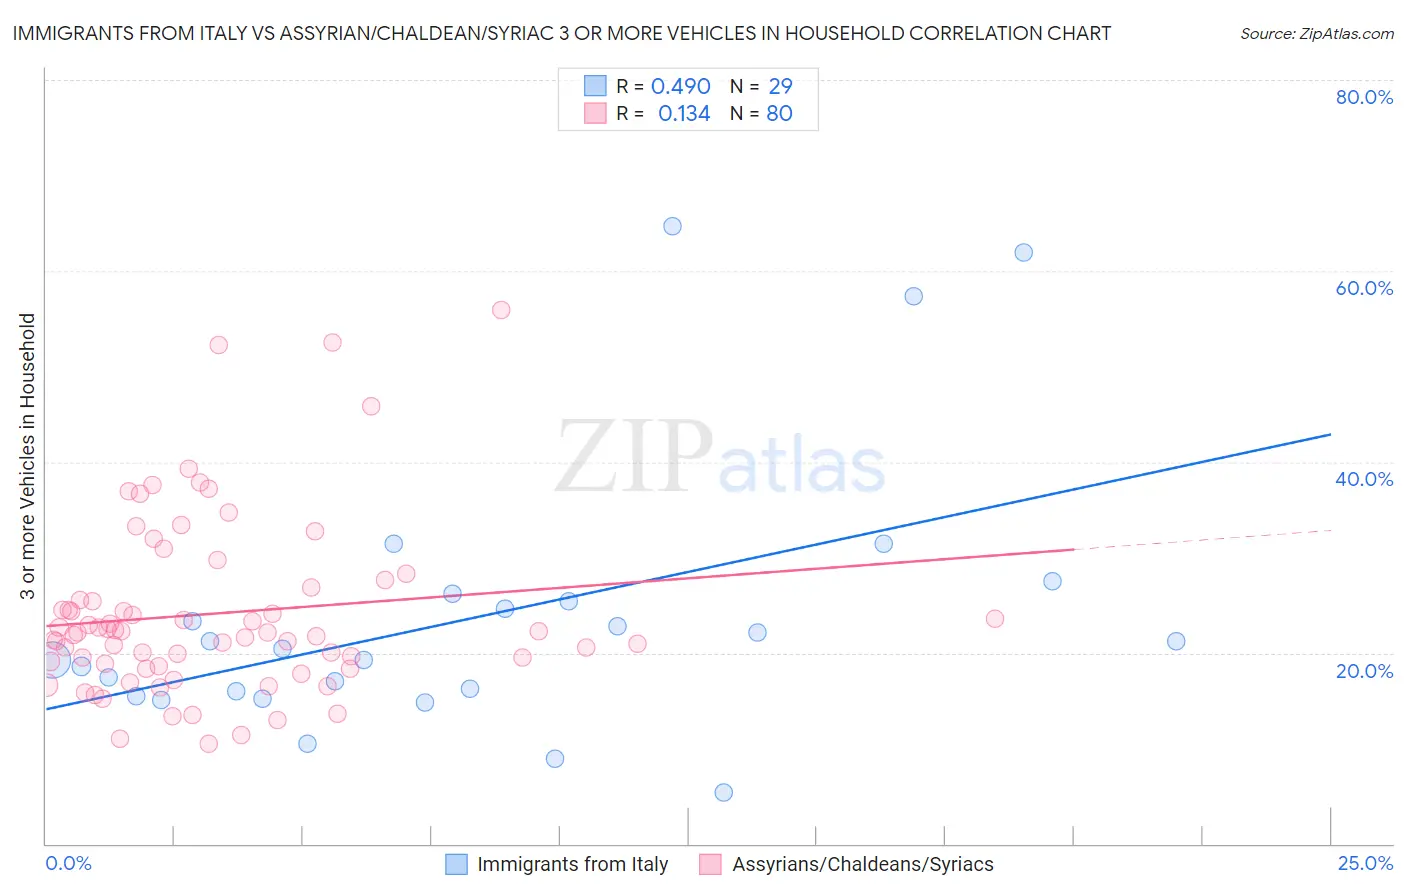
Immigrants from Italy vs Assyrian/Chaldean/Syriac 3 or more Vehicles in Household Correlation Chart
The statistical analysis conducted on geographies consisting of 324,064,061 people shows a moderate positive correlation between the proportion of Immigrants from Italy and percentage of households with 3 or more vehicles available in the United States with a correlation coefficient (R) of 0.490 and weighted average of 18.7%. Similarly, the statistical analysis conducted on geographies consisting of 110,285,741 people shows a poor positive correlation between the proportion of Assyrians/Chaldeans/Syriacs and percentage of households with 3 or more vehicles available in the United States with a correlation coefficient (R) of 0.134 and weighted average of 21.7%, a difference of 16.2%.
3 or more Vehicles in Household Correlation Summary
| Measurement | Immigrants from Italy | Assyrian/Chaldean/Syriac |
| Minimum | 5.4% | 10.5% |
| Maximum | 64.7% | 55.9% |
| Range | 59.3% | 45.4% |
| Mean | 23.8% | 24.1% |
| Median | 20.4% | 22.1% |
| Interquartile 25% (IQ1) | 15.7% | 18.7% |
| Interquartile 75% (IQ3) | 25.7% | 26.2% |
| Interquartile Range (IQR) | 10.0% | 7.4% |
| Standard Deviation (Sample) | 14.3% | 9.2% |
| Standard Deviation (Population) | 14.1% | 9.1% |
Similar Demographics by 3 or more Vehicles in Household
Demographics Similar to Immigrants from Italy by 3 or more Vehicles in Household
In terms of 3 or more vehicles in household, the demographic groups most similar to Immigrants from Italy are Immigrants from Nigeria (18.7%, a difference of 0.020%), Eastern European (18.7%, a difference of 0.080%), Immigrants from Sierra Leone (18.7%, a difference of 0.13%), Panamanian (18.8%, a difference of 0.28%), and Immigrants from Cuba (18.8%, a difference of 0.28%).
| Demographics | Rating | Rank | 3 or more Vehicles in Household |
| Bulgarians | 13.1 /100 | #210 | Poor 18.8% |
| Immigrants | Kenya | 12.4 /100 | #211 | Poor 18.8% |
| Panamanians | 11.6 /100 | #212 | Poor 18.8% |
| Immigrants | Cuba | 11.6 /100 | #213 | Poor 18.8% |
| Immigrants | Sierra Leone | 10.8 /100 | #214 | Poor 18.7% |
| Eastern Europeans | 10.6 /100 | #215 | Poor 18.7% |
| Immigrants | Nigeria | 10.3 /100 | #216 | Poor 18.7% |
| Immigrants | Italy | 10.2 /100 | #217 | Poor 18.7% |
| Immigrants | Portugal | 8.9 /100 | #218 | Tragic 18.6% |
| Immigrants | Armenia | 8.6 /100 | #219 | Tragic 18.6% |
| Nigerians | 7.9 /100 | #220 | Tragic 18.6% |
| Immigrants | Poland | 7.5 /100 | #221 | Tragic 18.6% |
| Belizeans | 7.3 /100 | #222 | Tragic 18.6% |
| Immigrants | Czechoslovakia | 5.9 /100 | #223 | Tragic 18.5% |
| Immigrants | Argentina | 5.6 /100 | #224 | Tragic 18.5% |
Demographics Similar to Assyrians/Chaldeans/Syriacs by 3 or more Vehicles in Household
In terms of 3 or more vehicles in household, the demographic groups most similar to Assyrians/Chaldeans/Syriacs are Czechoslovakian (21.7%, a difference of 0.0%), Irish (21.8%, a difference of 0.13%), Nonimmigrants (21.8%, a difference of 0.20%), Afghan (21.7%, a difference of 0.20%), and Japanese (21.8%, a difference of 0.25%).
| Demographics | Rating | Rank | 3 or more Vehicles in Household |
| Portuguese | 99.8 /100 | #72 | Exceptional 21.8% |
| Salvadorans | 99.8 /100 | #73 | Exceptional 21.8% |
| Immigrants | Oceania | 99.8 /100 | #74 | Exceptional 21.8% |
| Japanese | 99.8 /100 | #75 | Exceptional 21.8% |
| Immigrants | Nonimmigrants | 99.8 /100 | #76 | Exceptional 21.8% |
| Irish | 99.8 /100 | #77 | Exceptional 21.8% |
| Czechoslovakians | 99.8 /100 | #78 | Exceptional 21.7% |
| Assyrians/Chaldeans/Syriacs | 99.8 /100 | #79 | Exceptional 21.7% |
| Afghans | 99.7 /100 | #80 | Exceptional 21.7% |
| Celtics | 99.7 /100 | #81 | Exceptional 21.7% |
| Immigrants | El Salvador | 99.6 /100 | #82 | Exceptional 21.5% |
| Chippewa | 99.6 /100 | #83 | Exceptional 21.5% |
| Icelanders | 99.6 /100 | #84 | Exceptional 21.5% |
| Laotians | 99.6 /100 | #85 | Exceptional 21.5% |
| Delaware | 99.6 /100 | #86 | Exceptional 21.5% |