Immigrants from Zaire vs Assyrian/Chaldean/Syriac Family Households with Children
COMPARE
Immigrants from Zaire
Assyrian/Chaldean/Syriac
Family Households with Children
Family Households with Children Comparison
Immigrants from Zaire
Assyrians/Chaldeans/Syriacs
26.7%
FAMILY HOUSEHOLDS WITH CHILDREN
0.7/ 100
METRIC RATING
270th/ 347
METRIC RANK
28.1%
FAMILY HOUSEHOLDS WITH CHILDREN
98.7/ 100
METRIC RATING
102nd/ 347
METRIC RANK
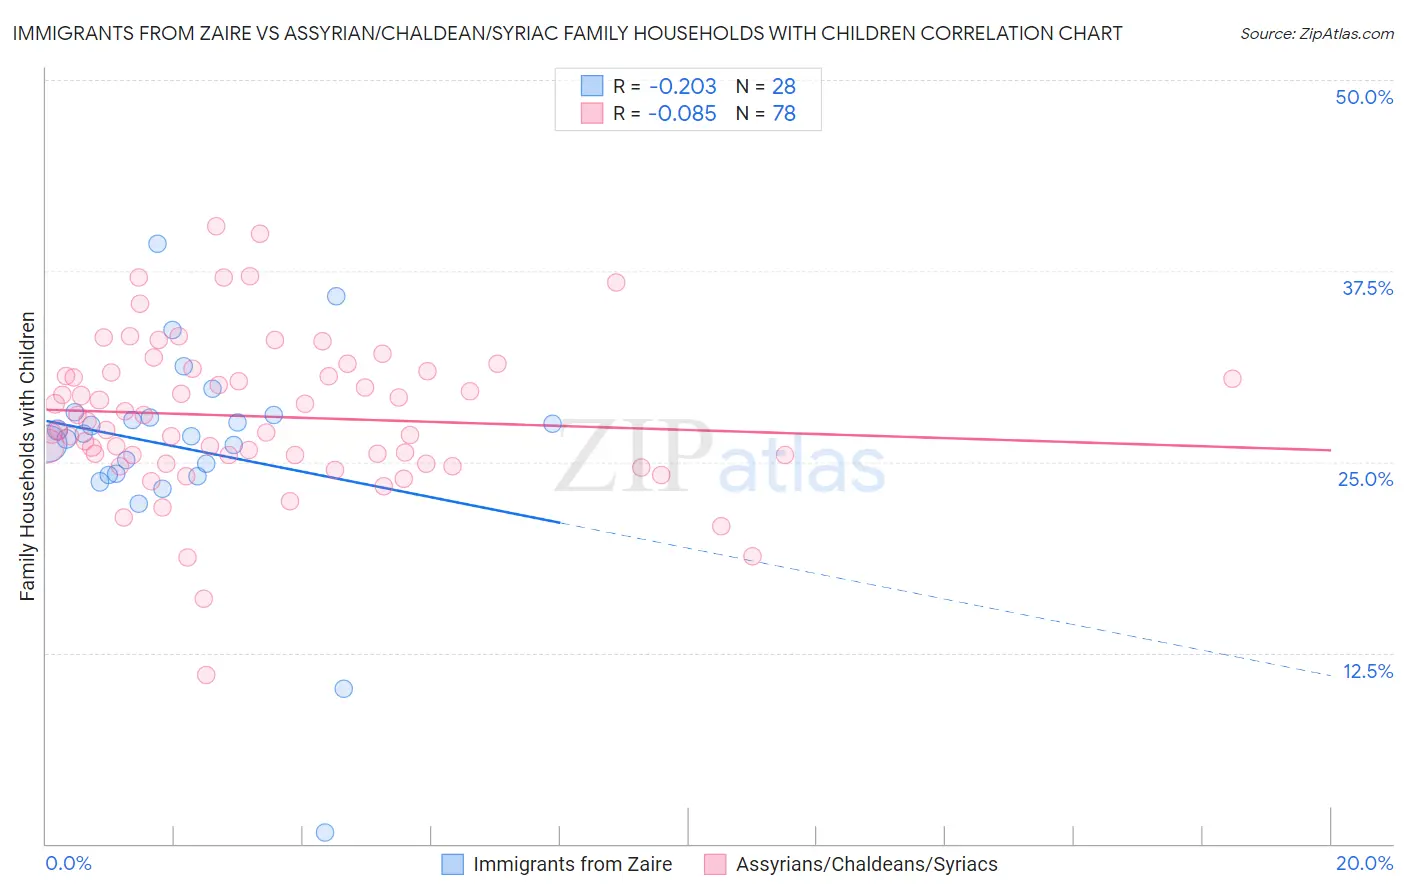
Immigrants from Zaire vs Assyrian/Chaldean/Syriac Family Households with Children Correlation Chart
The statistical analysis conducted on geographies consisting of 107,243,264 people shows a weak negative correlation between the proportion of Immigrants from Zaire and percentage of family households with children in the United States with a correlation coefficient (R) of -0.203 and weighted average of 26.7%. Similarly, the statistical analysis conducted on geographies consisting of 110,282,118 people shows a slight negative correlation between the proportion of Assyrians/Chaldeans/Syriacs and percentage of family households with children in the United States with a correlation coefficient (R) of -0.085 and weighted average of 28.1%, a difference of 5.2%.
Family Households with Children Correlation Summary
| Measurement | Immigrants from Zaire | Assyrian/Chaldean/Syriac |
| Minimum | 0.70% | 11.1% |
| Maximum | 39.2% | 40.5% |
| Range | 38.5% | 29.4% |
| Mean | 25.9% | 28.0% |
| Median | 26.8% | 27.4% |
| Interquartile 25% (IQ1) | 24.2% | 25.4% |
| Interquartile 75% (IQ3) | 28.0% | 30.8% |
| Interquartile Range (IQR) | 3.8% | 5.4% |
| Standard Deviation (Sample) | 7.0% | 5.0% |
| Standard Deviation (Population) | 6.9% | 5.0% |
Similar Demographics by Family Households with Children
Demographics Similar to Immigrants from Zaire by Family Households with Children
In terms of family households with children, the demographic groups most similar to Immigrants from Zaire are French (26.7%, a difference of 0.010%), Immigrants from Denmark (26.7%, a difference of 0.050%), Somali (26.7%, a difference of 0.080%), Immigrants from Belgium (26.7%, a difference of 0.10%), and Chippewa (26.7%, a difference of 0.11%).
| Demographics | Rating | Rank | Family Households with Children |
| Immigrants | North Macedonia | 1.0 /100 | #263 | Tragic 26.7% |
| Taiwanese | 0.9 /100 | #264 | Tragic 26.7% |
| Chippewa | 0.9 /100 | #265 | Tragic 26.7% |
| Maltese | 0.9 /100 | #266 | Tragic 26.7% |
| Immigrants | Uzbekistan | 0.9 /100 | #267 | Tragic 26.7% |
| Immigrants | Belgium | 0.9 /100 | #268 | Tragic 26.7% |
| Immigrants | Denmark | 0.8 /100 | #269 | Tragic 26.7% |
| Immigrants | Zaire | 0.7 /100 | #270 | Tragic 26.7% |
| French | 0.7 /100 | #271 | Tragic 26.7% |
| Somalis | 0.7 /100 | #272 | Tragic 26.7% |
| Immigrants | Hungary | 0.6 /100 | #273 | Tragic 26.7% |
| Eastern Europeans | 0.6 /100 | #274 | Tragic 26.7% |
| Immigrants | Northern Europe | 0.5 /100 | #275 | Tragic 26.7% |
| Immigrants | Spain | 0.5 /100 | #276 | Tragic 26.6% |
| Celtics | 0.4 /100 | #277 | Tragic 26.6% |
Demographics Similar to Assyrians/Chaldeans/Syriacs by Family Households with Children
In terms of family households with children, the demographic groups most similar to Assyrians/Chaldeans/Syriacs are Immigrants from Oceania (28.1%, a difference of 0.030%), Immigrants from the Azores (28.1%, a difference of 0.050%), Indonesian (28.1%, a difference of 0.050%), Immigrants from Kenya (28.1%, a difference of 0.060%), and Chilean (28.1%, a difference of 0.10%).
| Demographics | Rating | Rank | Family Households with Children |
| Immigrants | Nicaragua | 99.1 /100 | #95 | Exceptional 28.2% |
| Ute | 99.1 /100 | #96 | Exceptional 28.2% |
| Chileans | 98.9 /100 | #97 | Exceptional 28.1% |
| Immigrants | Kenya | 98.9 /100 | #98 | Exceptional 28.1% |
| Immigrants | Azores | 98.8 /100 | #99 | Exceptional 28.1% |
| Indonesians | 98.8 /100 | #100 | Exceptional 28.1% |
| Immigrants | Oceania | 98.8 /100 | #101 | Exceptional 28.1% |
| Assyrians/Chaldeans/Syriacs | 98.7 /100 | #102 | Exceptional 28.1% |
| Palestinians | 98.5 /100 | #103 | Exceptional 28.1% |
| Sioux | 98.3 /100 | #104 | Exceptional 28.1% |
| Choctaw | 98.3 /100 | #105 | Exceptional 28.1% |
| Immigrants | South America | 98.0 /100 | #106 | Exceptional 28.0% |
| Immigrants | Uganda | 97.7 /100 | #107 | Exceptional 28.0% |
| Immigrants | Burma/Myanmar | 97.7 /100 | #108 | Exceptional 28.0% |
| Tohono O'odham | 97.6 /100 | #109 | Exceptional 28.0% |