Immigrants from West Indies vs Lebanese 3 or more Vehicles in Household
COMPARE
Immigrants from West Indies
Lebanese
3 or more Vehicles in Household
3 or more Vehicles in Household Comparison
Immigrants from West Indies
Lebanese
14.6%
3 OR MORE VEHICLES IN HOUSEHOLD
0.0/ 100
METRIC RATING
322nd/ 347
METRIC RANK
20.0%
3 OR MORE VEHICLES IN HOUSEHOLD
79.8/ 100
METRIC RATING
152nd/ 347
METRIC RANK
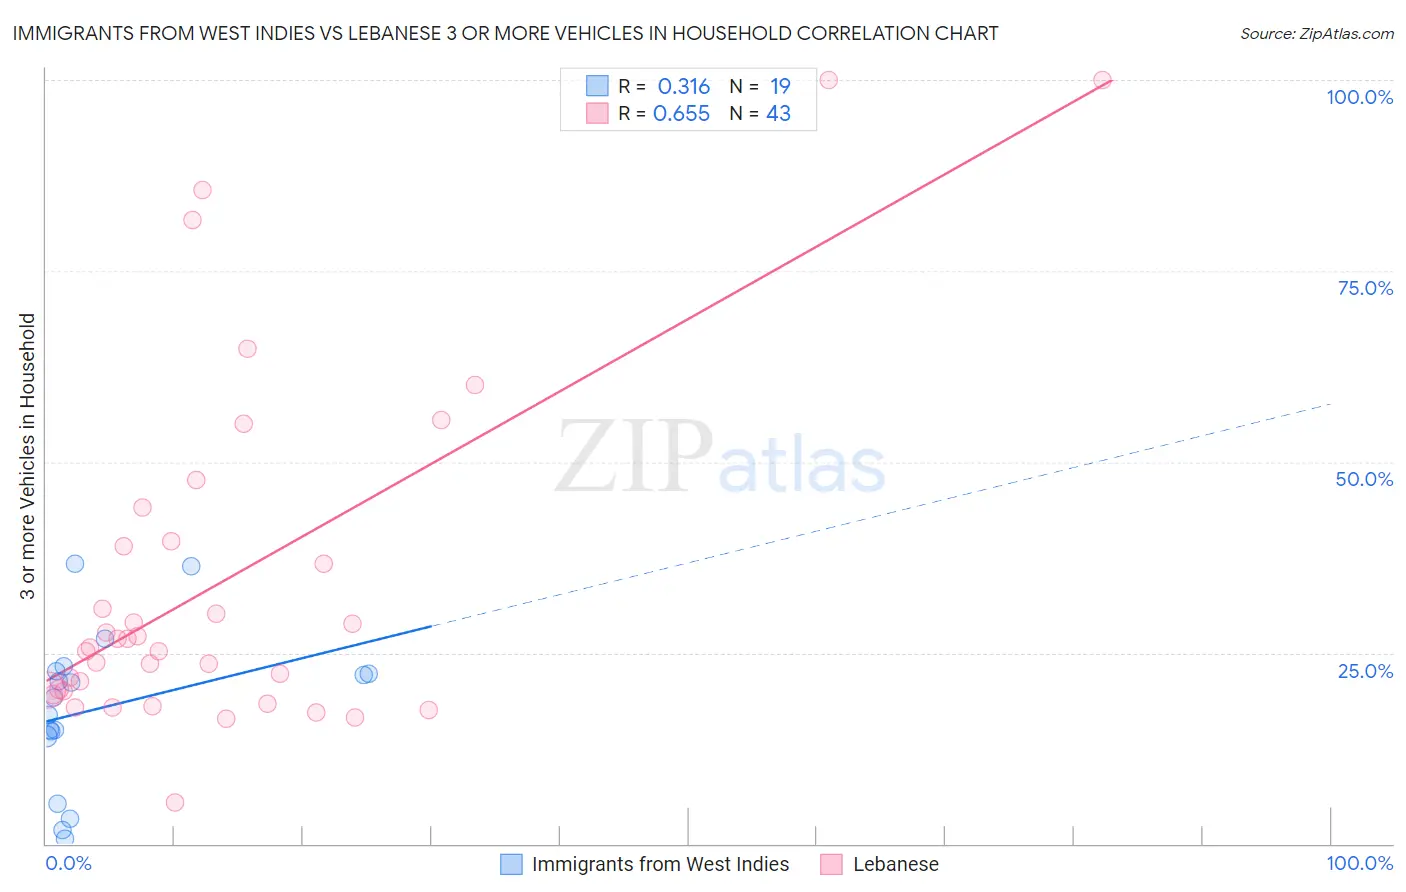
Immigrants from West Indies vs Lebanese 3 or more Vehicles in Household Correlation Chart
The statistical analysis conducted on geographies consisting of 72,454,628 people shows a mild positive correlation between the proportion of Immigrants from West Indies and percentage of households with 3 or more vehicles available in the United States with a correlation coefficient (R) of 0.316 and weighted average of 14.6%. Similarly, the statistical analysis conducted on geographies consisting of 401,196,452 people shows a significant positive correlation between the proportion of Lebanese and percentage of households with 3 or more vehicles available in the United States with a correlation coefficient (R) of 0.655 and weighted average of 20.0%, a difference of 36.7%.
3 or more Vehicles in Household Correlation Summary
| Measurement | Immigrants from West Indies | Lebanese |
| Minimum | 0.69% | 5.4% |
| Maximum | 36.6% | 100.0% |
| Range | 35.9% | 94.6% |
| Mean | 17.8% | 34.3% |
| Median | 19.1% | 25.8% |
| Interquartile 25% (IQ1) | 14.0% | 20.0% |
| Interquartile 75% (IQ3) | 22.6% | 39.6% |
| Interquartile Range (IQR) | 8.5% | 19.7% |
| Standard Deviation (Sample) | 10.1% | 22.7% |
| Standard Deviation (Population) | 9.9% | 22.4% |
Similar Demographics by 3 or more Vehicles in Household
Demographics Similar to Immigrants from West Indies by 3 or more Vehicles in Household
In terms of 3 or more vehicles in household, the demographic groups most similar to Immigrants from West Indies are Immigrants from Jamaica (14.7%, a difference of 0.31%), Immigrants from Caribbean (14.6%, a difference of 0.44%), Yup'ik (14.8%, a difference of 1.4%), Cape Verdean (15.0%, a difference of 2.5%), and Immigrants from Yemen (14.2%, a difference of 2.8%).
| Demographics | Rating | Rank | 3 or more Vehicles in Household |
| Haitians | 0.0 /100 | #315 | Tragic 15.5% |
| U.S. Virgin Islanders | 0.0 /100 | #316 | Tragic 15.4% |
| Jamaicans | 0.0 /100 | #317 | Tragic 15.2% |
| Immigrants | Haiti | 0.0 /100 | #318 | Tragic 15.2% |
| Cape Verdeans | 0.0 /100 | #319 | Tragic 15.0% |
| Yup'ik | 0.0 /100 | #320 | Tragic 14.8% |
| Immigrants | Jamaica | 0.0 /100 | #321 | Tragic 14.7% |
| Immigrants | West Indies | 0.0 /100 | #322 | Tragic 14.6% |
| Immigrants | Caribbean | 0.0 /100 | #323 | Tragic 14.6% |
| Immigrants | Yemen | 0.0 /100 | #324 | Tragic 14.2% |
| Senegalese | 0.0 /100 | #325 | Tragic 14.2% |
| Soviet Union | 0.0 /100 | #326 | Tragic 14.2% |
| Ecuadorians | 0.0 /100 | #327 | Tragic 14.1% |
| Immigrants | Albania | 0.0 /100 | #328 | Tragic 14.0% |
| Immigrants | Senegal | 0.0 /100 | #329 | Tragic 13.8% |
Demographics Similar to Lebanese by 3 or more Vehicles in Household
In terms of 3 or more vehicles in household, the demographic groups most similar to Lebanese are Taiwanese (20.0%, a difference of 0.10%), Immigrants (20.0%, a difference of 0.12%), Immigrants from Iran (20.0%, a difference of 0.13%), Guatemalan (20.1%, a difference of 0.34%), and Slovak (20.1%, a difference of 0.39%).
| Demographics | Rating | Rank | 3 or more Vehicles in Household |
| Palestinians | 83.9 /100 | #145 | Excellent 20.1% |
| Australians | 83.6 /100 | #146 | Excellent 20.1% |
| Slovaks | 83.0 /100 | #147 | Excellent 20.1% |
| Guatemalans | 82.6 /100 | #148 | Excellent 20.1% |
| Immigrants | Iran | 80.9 /100 | #149 | Excellent 20.0% |
| Immigrants | Immigrants | 80.8 /100 | #150 | Excellent 20.0% |
| Taiwanese | 80.6 /100 | #151 | Excellent 20.0% |
| Lebanese | 79.8 /100 | #152 | Good 20.0% |
| Yuman | 75.6 /100 | #153 | Good 19.9% |
| Immigrants | Jordan | 75.0 /100 | #154 | Good 19.9% |
| Tlingit-Haida | 73.4 /100 | #155 | Good 19.9% |
| Thais | 71.1 /100 | #156 | Good 19.8% |
| Hungarians | 70.5 /100 | #157 | Good 19.8% |
| Armenians | 68.8 /100 | #158 | Good 19.8% |
| Immigrants | Pakistan | 68.2 /100 | #159 | Good 19.8% |