Immigrants from West Indies vs Immigrants from Kuwait 3 or more Vehicles in Household
COMPARE
Immigrants from West Indies
Immigrants from Kuwait
3 or more Vehicles in Household
3 or more Vehicles in Household Comparison
Immigrants from West Indies
Immigrants from Kuwait
14.6%
3 OR MORE VEHICLES IN HOUSEHOLD
0.0/ 100
METRIC RATING
322nd/ 347
METRIC RANK
19.1%
3 OR MORE VEHICLES IN HOUSEHOLD
26.1/ 100
METRIC RATING
188th/ 347
METRIC RANK
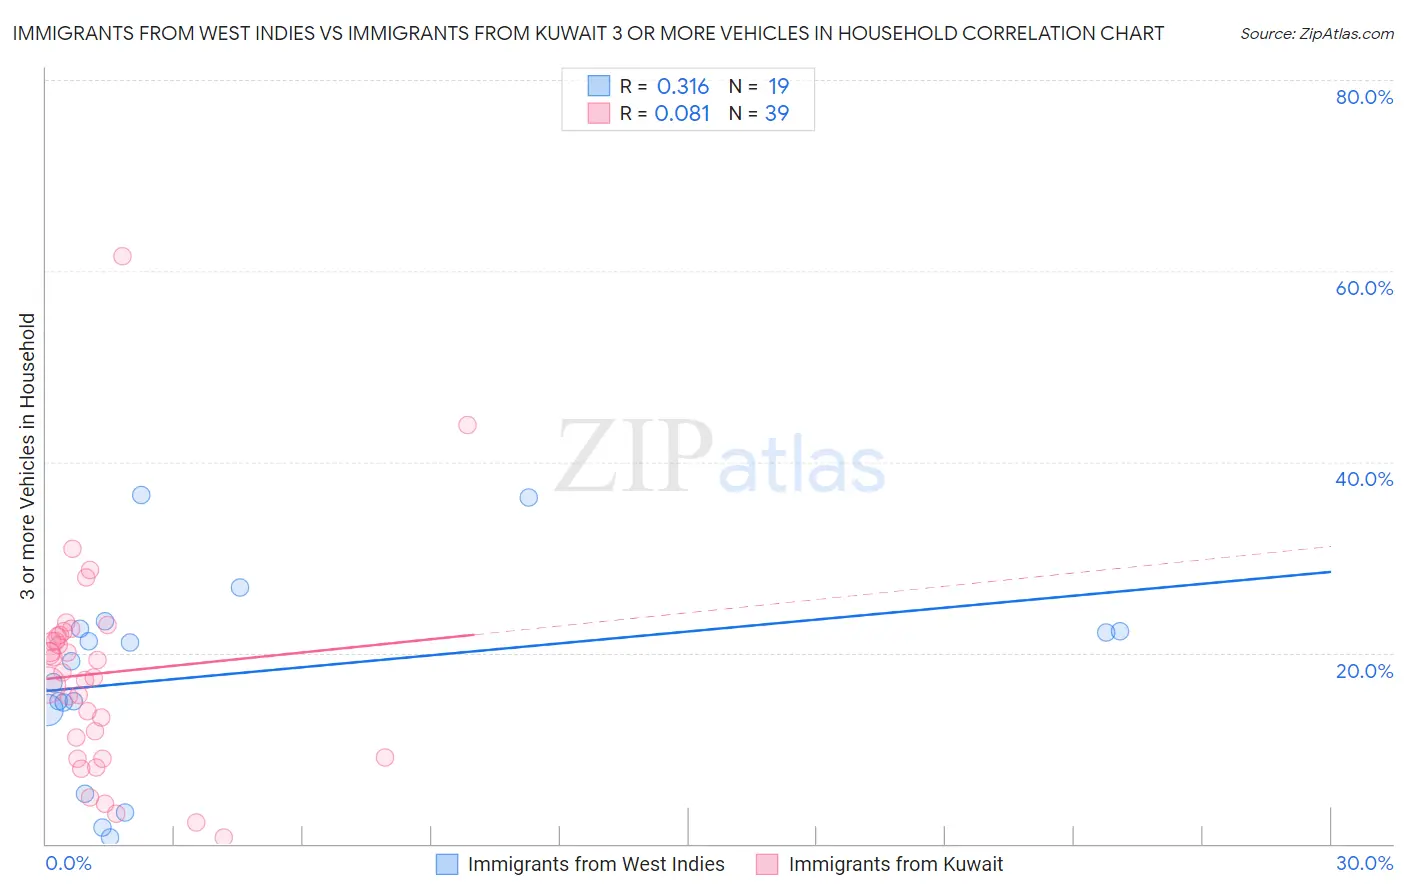
Immigrants from West Indies vs Immigrants from Kuwait 3 or more Vehicles in Household Correlation Chart
The statistical analysis conducted on geographies consisting of 72,454,628 people shows a mild positive correlation between the proportion of Immigrants from West Indies and percentage of households with 3 or more vehicles available in the United States with a correlation coefficient (R) of 0.316 and weighted average of 14.6%. Similarly, the statistical analysis conducted on geographies consisting of 136,861,731 people shows a slight positive correlation between the proportion of Immigrants from Kuwait and percentage of households with 3 or more vehicles available in the United States with a correlation coefficient (R) of 0.081 and weighted average of 19.1%, a difference of 30.7%.
3 or more Vehicles in Household Correlation Summary
| Measurement | Immigrants from West Indies | Immigrants from Kuwait |
| Minimum | 0.69% | 0.71% |
| Maximum | 36.6% | 61.6% |
| Range | 35.9% | 60.9% |
| Mean | 17.8% | 17.9% |
| Median | 19.1% | 17.9% |
| Interquartile 25% (IQ1) | 14.0% | 9.1% |
| Interquartile 75% (IQ3) | 22.6% | 21.8% |
| Interquartile Range (IQR) | 8.5% | 12.7% |
| Standard Deviation (Sample) | 10.1% | 11.3% |
| Standard Deviation (Population) | 9.9% | 11.1% |
Similar Demographics by 3 or more Vehicles in Household
Demographics Similar to Immigrants from West Indies by 3 or more Vehicles in Household
In terms of 3 or more vehicles in household, the demographic groups most similar to Immigrants from West Indies are Immigrants from Jamaica (14.7%, a difference of 0.31%), Immigrants from Caribbean (14.6%, a difference of 0.44%), Yup'ik (14.8%, a difference of 1.4%), Cape Verdean (15.0%, a difference of 2.5%), and Immigrants from Yemen (14.2%, a difference of 2.8%).
| Demographics | Rating | Rank | 3 or more Vehicles in Household |
| Haitians | 0.0 /100 | #315 | Tragic 15.5% |
| U.S. Virgin Islanders | 0.0 /100 | #316 | Tragic 15.4% |
| Jamaicans | 0.0 /100 | #317 | Tragic 15.2% |
| Immigrants | Haiti | 0.0 /100 | #318 | Tragic 15.2% |
| Cape Verdeans | 0.0 /100 | #319 | Tragic 15.0% |
| Yup'ik | 0.0 /100 | #320 | Tragic 14.8% |
| Immigrants | Jamaica | 0.0 /100 | #321 | Tragic 14.7% |
| Immigrants | West Indies | 0.0 /100 | #322 | Tragic 14.6% |
| Immigrants | Caribbean | 0.0 /100 | #323 | Tragic 14.6% |
| Immigrants | Yemen | 0.0 /100 | #324 | Tragic 14.2% |
| Senegalese | 0.0 /100 | #325 | Tragic 14.2% |
| Soviet Union | 0.0 /100 | #326 | Tragic 14.2% |
| Ecuadorians | 0.0 /100 | #327 | Tragic 14.1% |
| Immigrants | Albania | 0.0 /100 | #328 | Tragic 14.0% |
| Immigrants | Senegal | 0.0 /100 | #329 | Tragic 13.8% |
Demographics Similar to Immigrants from Kuwait by 3 or more Vehicles in Household
In terms of 3 or more vehicles in household, the demographic groups most similar to Immigrants from Kuwait are Indian (Asian) (19.1%, a difference of 0.010%), Immigrants from Zimbabwe (19.1%, a difference of 0.060%), South American Indian (19.1%, a difference of 0.070%), Kenyan (19.1%, a difference of 0.14%), and Tsimshian (19.1%, a difference of 0.17%).
| Demographics | Rating | Rank | 3 or more Vehicles in Household |
| Romanians | 37.1 /100 | #181 | Fair 19.3% |
| Cubans | 36.6 /100 | #182 | Fair 19.3% |
| Cajuns | 36.0 /100 | #183 | Fair 19.3% |
| Latvians | 35.7 /100 | #184 | Fair 19.3% |
| Immigrants | Sri Lanka | 30.7 /100 | #185 | Fair 19.2% |
| Immigrants | Sweden | 29.0 /100 | #186 | Fair 19.2% |
| Immigrants | Hong Kong | 28.3 /100 | #187 | Fair 19.2% |
| Immigrants | Kuwait | 26.1 /100 | #188 | Fair 19.1% |
| Indians (Asian) | 26.0 /100 | #189 | Fair 19.1% |
| Immigrants | Zimbabwe | 25.5 /100 | #190 | Fair 19.1% |
| South American Indians | 25.4 /100 | #191 | Fair 19.1% |
| Kenyans | 24.7 /100 | #192 | Fair 19.1% |
| Tsimshian | 24.4 /100 | #193 | Fair 19.1% |
| Serbians | 24.0 /100 | #194 | Fair 19.1% |
| Immigrants | Moldova | 23.6 /100 | #195 | Fair 19.1% |