Immigrants from West Indies vs Immigrants from North America 3 or more Vehicles in Household
COMPARE
Immigrants from West Indies
Immigrants from North America
3 or more Vehicles in Household
3 or more Vehicles in Household Comparison
Immigrants from West Indies
Immigrants from North America
14.6%
3 OR MORE VEHICLES IN HOUSEHOLD
0.0/ 100
METRIC RATING
322nd/ 347
METRIC RANK
20.2%
3 OR MORE VEHICLES IN HOUSEHOLD
87.8/ 100
METRIC RATING
133rd/ 347
METRIC RANK
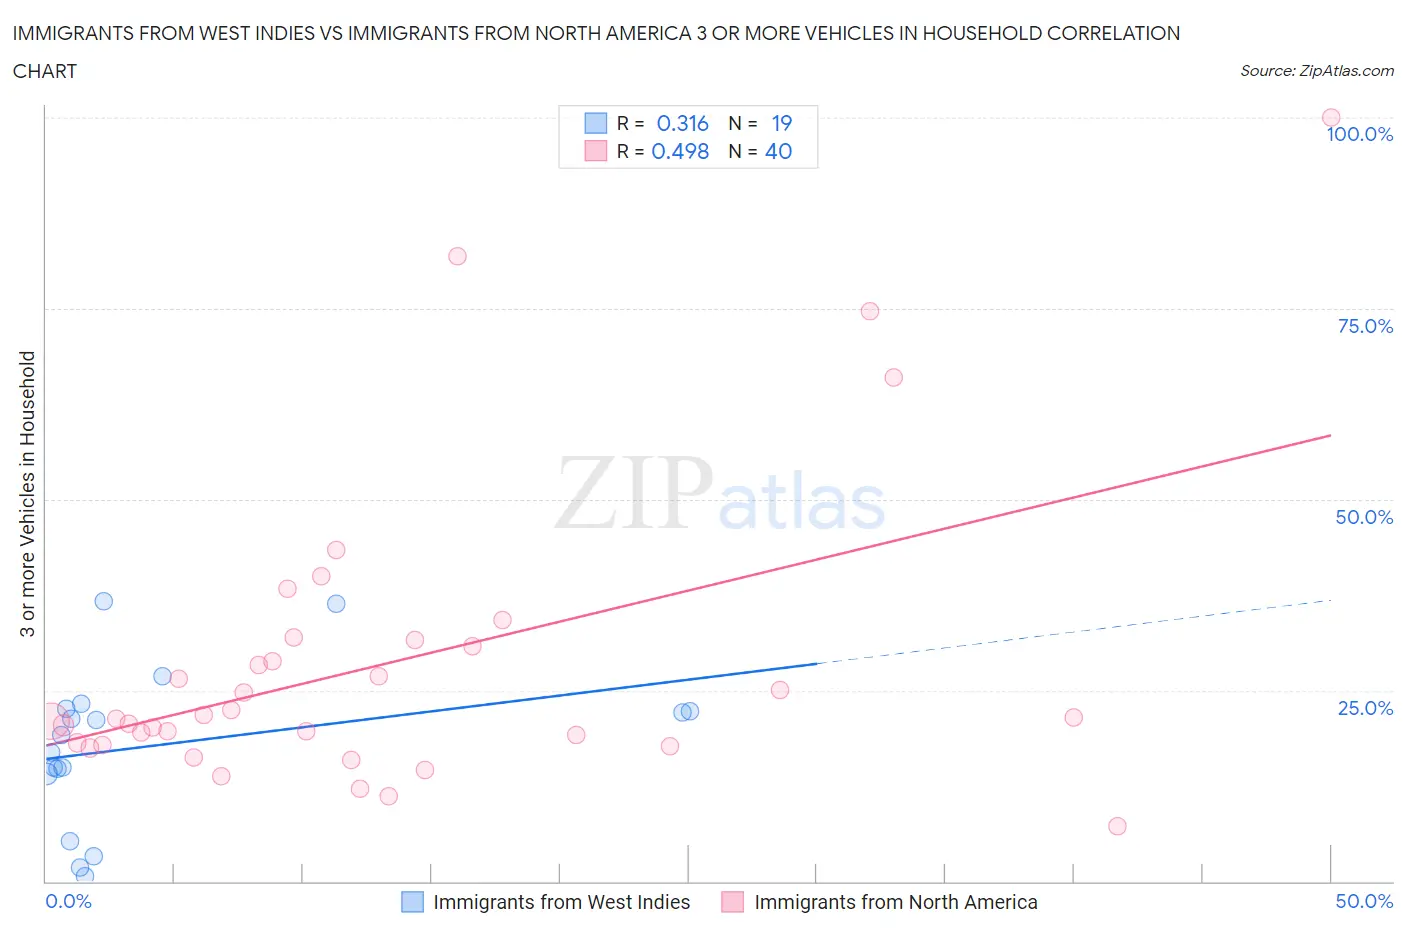
Immigrants from West Indies vs Immigrants from North America 3 or more Vehicles in Household Correlation Chart
The statistical analysis conducted on geographies consisting of 72,454,628 people shows a mild positive correlation between the proportion of Immigrants from West Indies and percentage of households with 3 or more vehicles available in the United States with a correlation coefficient (R) of 0.316 and weighted average of 14.6%. Similarly, the statistical analysis conducted on geographies consisting of 462,036,046 people shows a moderate positive correlation between the proportion of Immigrants from North America and percentage of households with 3 or more vehicles available in the United States with a correlation coefficient (R) of 0.498 and weighted average of 20.2%, a difference of 38.3%.
3 or more Vehicles in Household Correlation Summary
| Measurement | Immigrants from West Indies | Immigrants from North America |
| Minimum | 0.69% | 7.1% |
| Maximum | 36.6% | 100.0% |
| Range | 35.9% | 92.9% |
| Mean | 17.8% | 28.5% |
| Median | 19.1% | 21.4% |
| Interquartile 25% (IQ1) | 14.0% | 18.0% |
| Interquartile 75% (IQ3) | 22.6% | 31.1% |
| Interquartile Range (IQR) | 8.5% | 13.1% |
| Standard Deviation (Sample) | 10.1% | 19.6% |
| Standard Deviation (Population) | 9.9% | 19.4% |
Similar Demographics by 3 or more Vehicles in Household
Demographics Similar to Immigrants from West Indies by 3 or more Vehicles in Household
In terms of 3 or more vehicles in household, the demographic groups most similar to Immigrants from West Indies are Immigrants from Jamaica (14.7%, a difference of 0.31%), Immigrants from Caribbean (14.6%, a difference of 0.44%), Yup'ik (14.8%, a difference of 1.4%), Cape Verdean (15.0%, a difference of 2.5%), and Immigrants from Yemen (14.2%, a difference of 2.8%).
| Demographics | Rating | Rank | 3 or more Vehicles in Household |
| Haitians | 0.0 /100 | #315 | Tragic 15.5% |
| U.S. Virgin Islanders | 0.0 /100 | #316 | Tragic 15.4% |
| Jamaicans | 0.0 /100 | #317 | Tragic 15.2% |
| Immigrants | Haiti | 0.0 /100 | #318 | Tragic 15.2% |
| Cape Verdeans | 0.0 /100 | #319 | Tragic 15.0% |
| Yup'ik | 0.0 /100 | #320 | Tragic 14.8% |
| Immigrants | Jamaica | 0.0 /100 | #321 | Tragic 14.7% |
| Immigrants | West Indies | 0.0 /100 | #322 | Tragic 14.6% |
| Immigrants | Caribbean | 0.0 /100 | #323 | Tragic 14.6% |
| Immigrants | Yemen | 0.0 /100 | #324 | Tragic 14.2% |
| Senegalese | 0.0 /100 | #325 | Tragic 14.2% |
| Soviet Union | 0.0 /100 | #326 | Tragic 14.2% |
| Ecuadorians | 0.0 /100 | #327 | Tragic 14.1% |
| Immigrants | Albania | 0.0 /100 | #328 | Tragic 14.0% |
| Immigrants | Senegal | 0.0 /100 | #329 | Tragic 13.8% |
Demographics Similar to Immigrants from North America by 3 or more Vehicles in Household
In terms of 3 or more vehicles in household, the demographic groups most similar to Immigrants from North America are Immigrants from Canada (20.2%, a difference of 0.0%), Immigrants from Asia (20.2%, a difference of 0.050%), Polish (20.2%, a difference of 0.090%), Immigrants from India (20.2%, a difference of 0.11%), and Immigrants from Nicaragua (20.2%, a difference of 0.12%).
| Demographics | Rating | Rank | 3 or more Vehicles in Household |
| Slavs | 92.1 /100 | #126 | Exceptional 20.4% |
| Immigrants | Bolivia | 92.0 /100 | #127 | Exceptional 20.4% |
| New Zealanders | 91.3 /100 | #128 | Exceptional 20.4% |
| Zimbabweans | 88.7 /100 | #129 | Excellent 20.3% |
| Greeks | 88.6 /100 | #130 | Excellent 20.3% |
| Immigrants | Asia | 88.1 /100 | #131 | Excellent 20.2% |
| Immigrants | Canada | 87.8 /100 | #132 | Excellent 20.2% |
| Immigrants | North America | 87.8 /100 | #133 | Excellent 20.2% |
| Poles | 87.3 /100 | #134 | Excellent 20.2% |
| Immigrants | India | 87.2 /100 | #135 | Excellent 20.2% |
| Immigrants | Nicaragua | 87.1 /100 | #136 | Excellent 20.2% |
| Immigrants | Iraq | 87.1 /100 | #137 | Excellent 20.2% |
| Aleuts | 86.3 /100 | #138 | Excellent 20.2% |
| Slovenes | 85.5 /100 | #139 | Excellent 20.2% |
| French American Indians | 85.3 /100 | #140 | Excellent 20.1% |