Immigrants from Uzbekistan vs French American Indian 3 or more Vehicles in Household
COMPARE
Immigrants from Uzbekistan
French American Indian
3 or more Vehicles in Household
3 or more Vehicles in Household Comparison
Immigrants from Uzbekistan
French American Indians
12.0%
3 OR MORE VEHICLES IN HOUSEHOLD
0.0/ 100
METRIC RATING
339th/ 347
METRIC RANK
20.1%
3 OR MORE VEHICLES IN HOUSEHOLD
85.3/ 100
METRIC RATING
140th/ 347
METRIC RANK
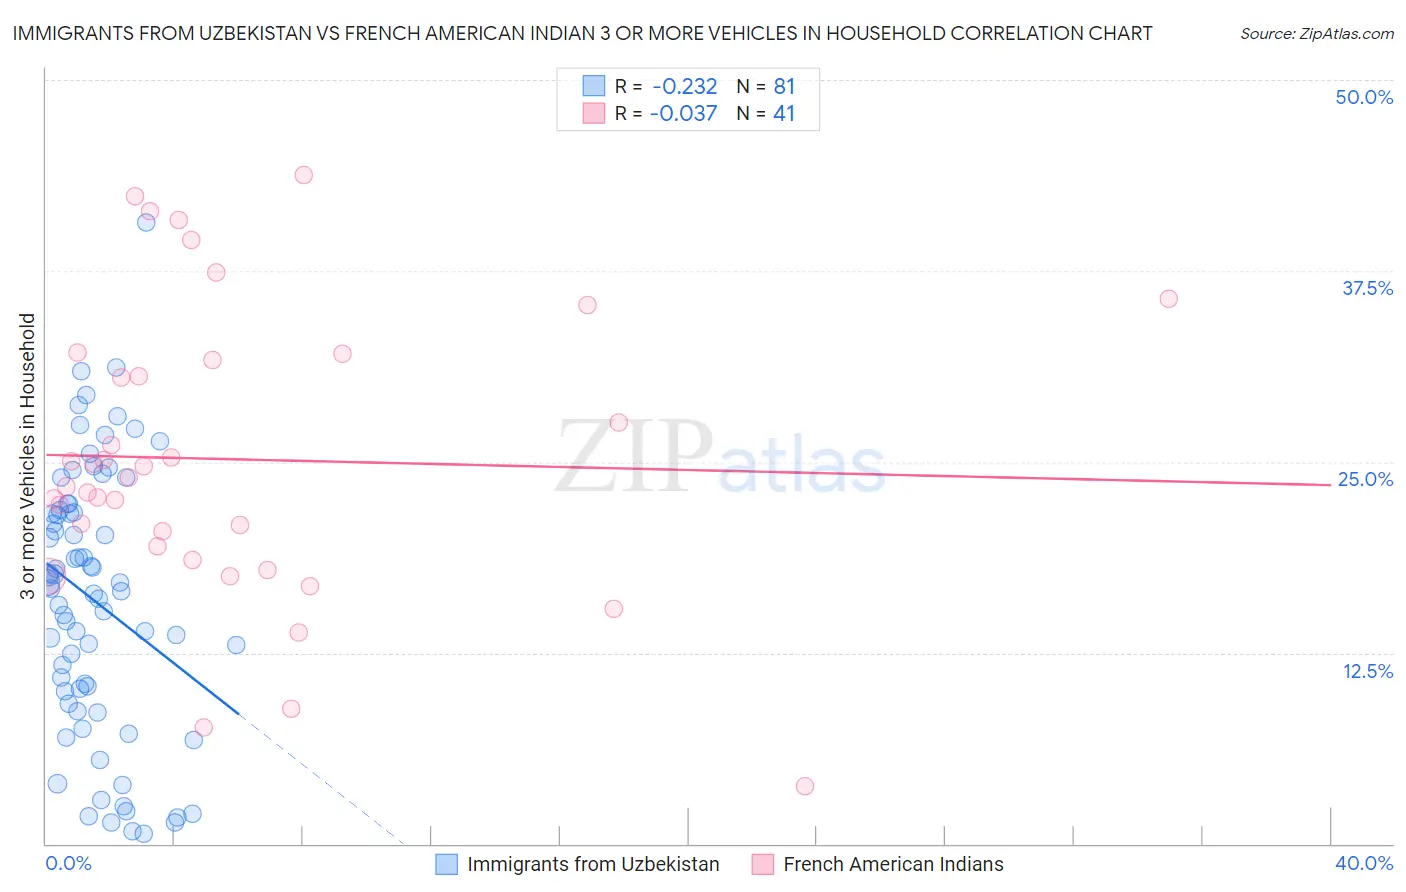
Immigrants from Uzbekistan vs French American Indian 3 or more Vehicles in Household Correlation Chart
The statistical analysis conducted on geographies consisting of 118,708,326 people shows a weak negative correlation between the proportion of Immigrants from Uzbekistan and percentage of households with 3 or more vehicles available in the United States with a correlation coefficient (R) of -0.232 and weighted average of 12.0%. Similarly, the statistical analysis conducted on geographies consisting of 131,968,007 people shows no correlation between the proportion of French American Indians and percentage of households with 3 or more vehicles available in the United States with a correlation coefficient (R) of -0.037 and weighted average of 20.1%, a difference of 68.1%.
3 or more Vehicles in Household Correlation Summary
| Measurement | Immigrants from Uzbekistan | French American Indian |
| Minimum | 0.69% | 3.7% |
| Maximum | 40.7% | 43.8% |
| Range | 40.0% | 40.0% |
| Mean | 15.9% | 25.2% |
| Median | 16.7% | 24.0% |
| Interquartile 25% (IQ1) | 9.6% | 19.0% |
| Interquartile 75% (IQ3) | 21.8% | 31.9% |
| Interquartile Range (IQR) | 12.2% | 12.8% |
| Standard Deviation (Sample) | 8.7% | 9.5% |
| Standard Deviation (Population) | 8.7% | 9.4% |
Similar Demographics by 3 or more Vehicles in Household
Demographics Similar to Immigrants from Uzbekistan by 3 or more Vehicles in Household
In terms of 3 or more vehicles in household, the demographic groups most similar to Immigrants from Uzbekistan are Immigrants from Barbados (11.7%, a difference of 2.2%), Vietnamese (12.5%, a difference of 3.9%), Immigrants from Bangladesh (12.5%, a difference of 4.4%), Guyanese (11.5%, a difference of 4.7%), and British West Indian (11.4%, a difference of 4.7%).
| Demographics | Rating | Rank | 3 or more Vehicles in Household |
| Trinidadians and Tobagonians | 0.0 /100 | #332 | Tragic 13.6% |
| Immigrants | Cabo Verde | 0.0 /100 | #333 | Tragic 13.6% |
| Immigrants | Ecuador | 0.0 /100 | #334 | Tragic 13.4% |
| Immigrants | Trinidad and Tobago | 0.0 /100 | #335 | Tragic 13.3% |
| Barbadians | 0.0 /100 | #336 | Tragic 12.6% |
| Immigrants | Bangladesh | 0.0 /100 | #337 | Tragic 12.5% |
| Vietnamese | 0.0 /100 | #338 | Tragic 12.5% |
| Immigrants | Uzbekistan | 0.0 /100 | #339 | Tragic 12.0% |
| Immigrants | Barbados | 0.0 /100 | #340 | Tragic 11.7% |
| Guyanese | 0.0 /100 | #341 | Tragic 11.5% |
| British West Indians | 0.0 /100 | #342 | Tragic 11.4% |
| Immigrants | Guyana | 0.0 /100 | #343 | Tragic 11.2% |
| Dominicans | 0.0 /100 | #344 | Tragic 11.2% |
| Immigrants | Dominican Republic | 0.0 /100 | #345 | Tragic 10.4% |
| Immigrants | St. Vincent and the Grenadines | 0.0 /100 | #346 | Tragic 10.1% |
Demographics Similar to French American Indians by 3 or more Vehicles in Household
In terms of 3 or more vehicles in household, the demographic groups most similar to French American Indians are Slovene (20.2%, a difference of 0.030%), Ottawa (20.1%, a difference of 0.060%), Jordanian (20.1%, a difference of 0.12%), Lithuanian (20.1%, a difference of 0.13%), and Aleut (20.2%, a difference of 0.15%).
| Demographics | Rating | Rank | 3 or more Vehicles in Household |
| Immigrants | North America | 87.8 /100 | #133 | Excellent 20.2% |
| Poles | 87.3 /100 | #134 | Excellent 20.2% |
| Immigrants | India | 87.2 /100 | #135 | Excellent 20.2% |
| Immigrants | Nicaragua | 87.1 /100 | #136 | Excellent 20.2% |
| Immigrants | Iraq | 87.1 /100 | #137 | Excellent 20.2% |
| Aleuts | 86.3 /100 | #138 | Excellent 20.2% |
| Slovenes | 85.5 /100 | #139 | Excellent 20.2% |
| French American Indians | 85.3 /100 | #140 | Excellent 20.1% |
| Ottawa | 84.9 /100 | #141 | Excellent 20.1% |
| Jordanians | 84.4 /100 | #142 | Excellent 20.1% |
| Lithuanians | 84.4 /100 | #143 | Excellent 20.1% |
| Iranians | 84.0 /100 | #144 | Excellent 20.1% |
| Palestinians | 83.9 /100 | #145 | Excellent 20.1% |
| Australians | 83.6 /100 | #146 | Excellent 20.1% |
| Slovaks | 83.0 /100 | #147 | Excellent 20.1% |