Immigrants from Uzbekistan vs Finnish 3 or more Vehicles in Household
COMPARE
Immigrants from Uzbekistan
Finnish
3 or more Vehicles in Household
3 or more Vehicles in Household Comparison
Immigrants from Uzbekistan
Finns
12.0%
3 OR MORE VEHICLES IN HOUSEHOLD
0.0/ 100
METRIC RATING
339th/ 347
METRIC RANK
22.3%
3 OR MORE VEHICLES IN HOUSEHOLD
99.9/ 100
METRIC RATING
60th/ 347
METRIC RANK
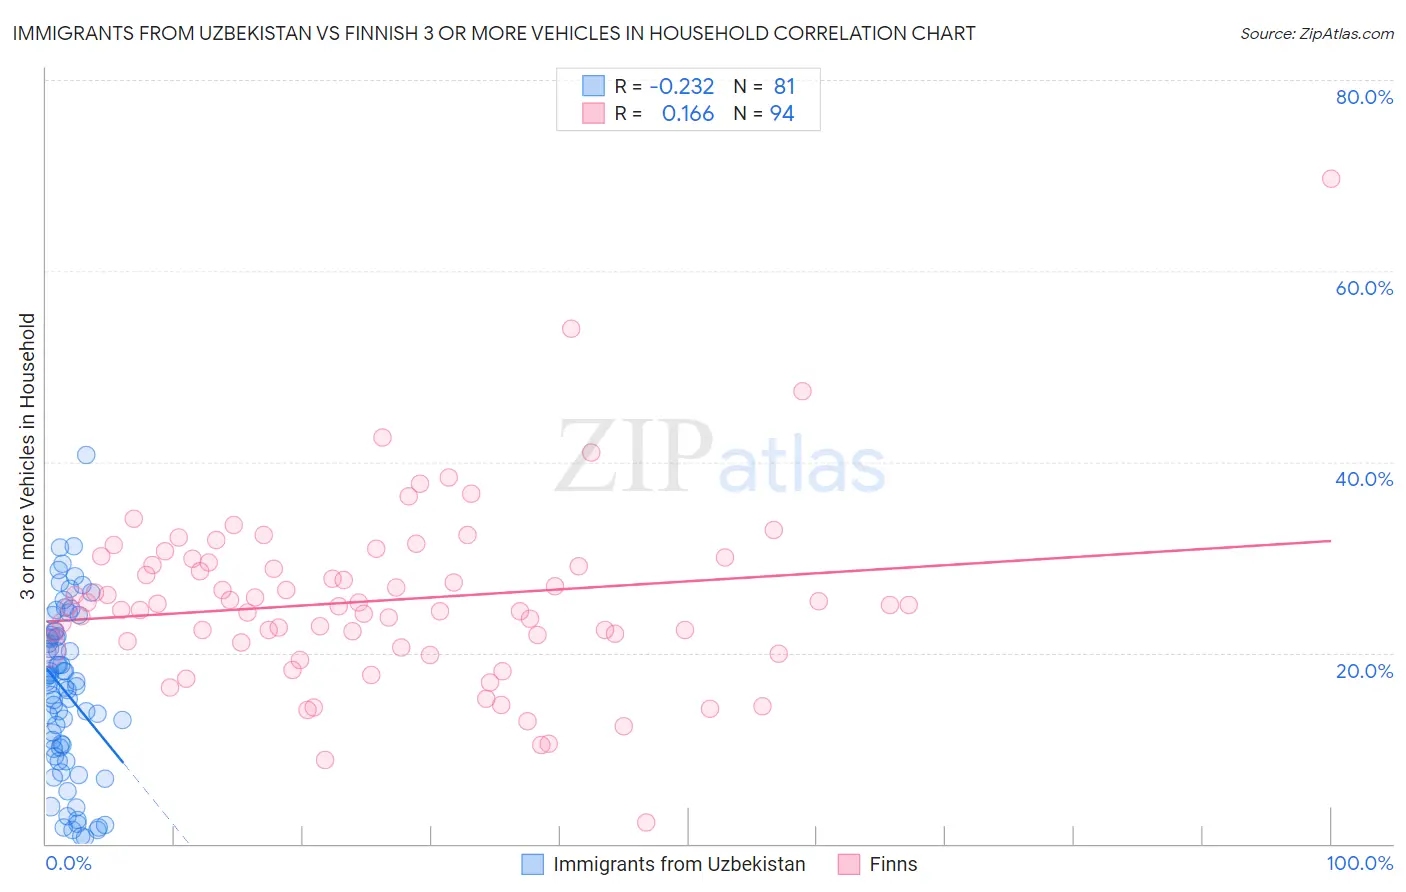
Immigrants from Uzbekistan vs Finnish 3 or more Vehicles in Household Correlation Chart
The statistical analysis conducted on geographies consisting of 118,708,326 people shows a weak negative correlation between the proportion of Immigrants from Uzbekistan and percentage of households with 3 or more vehicles available in the United States with a correlation coefficient (R) of -0.232 and weighted average of 12.0%. Similarly, the statistical analysis conducted on geographies consisting of 404,442,168 people shows a poor positive correlation between the proportion of Finns and percentage of households with 3 or more vehicles available in the United States with a correlation coefficient (R) of 0.166 and weighted average of 22.3%, a difference of 85.9%.
3 or more Vehicles in Household Correlation Summary
| Measurement | Immigrants from Uzbekistan | Finnish |
| Minimum | 0.69% | 2.2% |
| Maximum | 40.7% | 69.6% |
| Range | 40.0% | 67.4% |
| Mean | 15.9% | 25.5% |
| Median | 16.7% | 25.0% |
| Interquartile 25% (IQ1) | 9.6% | 21.1% |
| Interquartile 75% (IQ3) | 21.8% | 29.4% |
| Interquartile Range (IQR) | 12.2% | 8.3% |
| Standard Deviation (Sample) | 8.7% | 9.3% |
| Standard Deviation (Population) | 8.7% | 9.2% |
Similar Demographics by 3 or more Vehicles in Household
Demographics Similar to Immigrants from Uzbekistan by 3 or more Vehicles in Household
In terms of 3 or more vehicles in household, the demographic groups most similar to Immigrants from Uzbekistan are Immigrants from Barbados (11.7%, a difference of 2.2%), Vietnamese (12.5%, a difference of 3.9%), Immigrants from Bangladesh (12.5%, a difference of 4.4%), Guyanese (11.5%, a difference of 4.7%), and British West Indian (11.4%, a difference of 4.7%).
| Demographics | Rating | Rank | 3 or more Vehicles in Household |
| Trinidadians and Tobagonians | 0.0 /100 | #332 | Tragic 13.6% |
| Immigrants | Cabo Verde | 0.0 /100 | #333 | Tragic 13.6% |
| Immigrants | Ecuador | 0.0 /100 | #334 | Tragic 13.4% |
| Immigrants | Trinidad and Tobago | 0.0 /100 | #335 | Tragic 13.3% |
| Barbadians | 0.0 /100 | #336 | Tragic 12.6% |
| Immigrants | Bangladesh | 0.0 /100 | #337 | Tragic 12.5% |
| Vietnamese | 0.0 /100 | #338 | Tragic 12.5% |
| Immigrants | Uzbekistan | 0.0 /100 | #339 | Tragic 12.0% |
| Immigrants | Barbados | 0.0 /100 | #340 | Tragic 11.7% |
| Guyanese | 0.0 /100 | #341 | Tragic 11.5% |
| British West Indians | 0.0 /100 | #342 | Tragic 11.4% |
| Immigrants | Guyana | 0.0 /100 | #343 | Tragic 11.2% |
| Dominicans | 0.0 /100 | #344 | Tragic 11.2% |
| Immigrants | Dominican Republic | 0.0 /100 | #345 | Tragic 10.4% |
| Immigrants | St. Vincent and the Grenadines | 0.0 /100 | #346 | Tragic 10.1% |
Demographics Similar to Finns by 3 or more Vehicles in Household
In terms of 3 or more vehicles in household, the demographic groups most similar to Finns are Navajo (22.3%, a difference of 0.090%), Spaniard (22.3%, a difference of 0.15%), Bhutanese (22.2%, a difference of 0.16%), Fijian (22.2%, a difference of 0.20%), and Pennsylvania German (22.3%, a difference of 0.28%).
| Demographics | Rating | Rank | 3 or more Vehicles in Household |
| Czechs | 100.0 /100 | #53 | Exceptional 22.5% |
| Crow | 100.0 /100 | #54 | Exceptional 22.5% |
| Immigrants | Laos | 100.0 /100 | #55 | Exceptional 22.4% |
| Hispanics or Latinos | 100.0 /100 | #56 | Exceptional 22.4% |
| Pennsylvania Germans | 100.0 /100 | #57 | Exceptional 22.3% |
| Spaniards | 100.0 /100 | #58 | Exceptional 22.3% |
| Navajo | 100.0 /100 | #59 | Exceptional 22.3% |
| Finns | 99.9 /100 | #60 | Exceptional 22.3% |
| Bhutanese | 99.9 /100 | #61 | Exceptional 22.2% |
| Fijians | 99.9 /100 | #62 | Exceptional 22.2% |
| Chickasaw | 99.9 /100 | #63 | Exceptional 22.2% |
| Immigrants | Taiwan | 99.9 /100 | #64 | Exceptional 22.1% |
| Pima | 99.9 /100 | #65 | Exceptional 22.0% |
| Northern Europeans | 99.9 /100 | #66 | Exceptional 22.0% |
| Alaskan Athabascans | 99.9 /100 | #67 | Exceptional 21.9% |