Immigrants from Uzbekistan vs Immigrants from Scotland Cognitive Disability
COMPARE
Immigrants from Uzbekistan
Immigrants from Scotland
Cognitive Disability
Cognitive Disability Comparison
Immigrants from Uzbekistan
Immigrants from Scotland
16.7%
COGNITIVE DISABILITY
99.4/ 100
METRIC RATING
69th/ 347
METRIC RANK
16.2%
COGNITIVE DISABILITY
100.0/ 100
METRIC RATING
10th/ 347
METRIC RANK
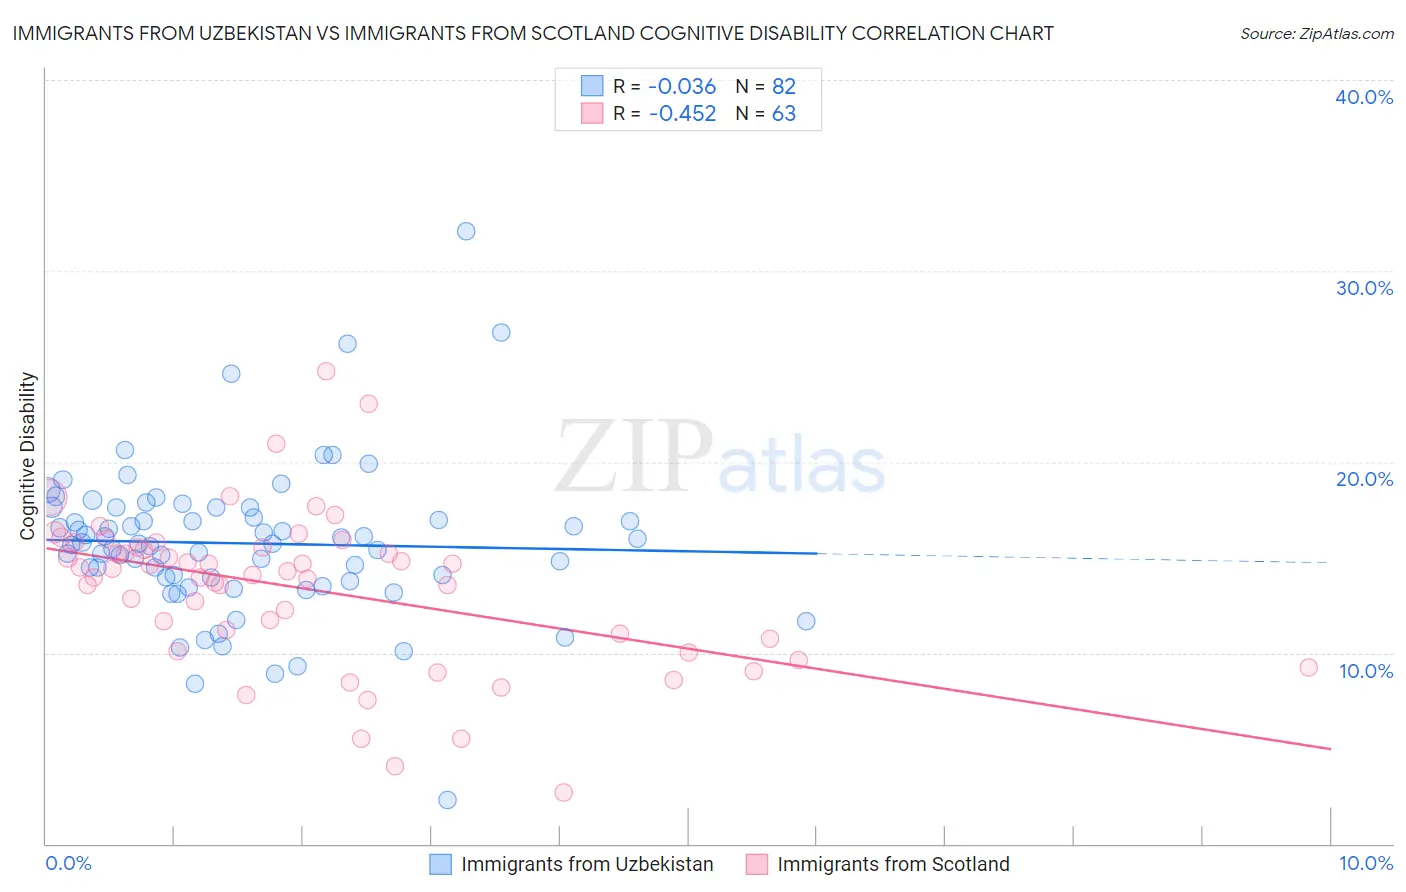
Immigrants from Uzbekistan vs Immigrants from Scotland Cognitive Disability Correlation Chart
The statistical analysis conducted on geographies consisting of 118,751,620 people shows no correlation between the proportion of Immigrants from Uzbekistan and percentage of population with cognitive disability in the United States with a correlation coefficient (R) of -0.036 and weighted average of 16.7%. Similarly, the statistical analysis conducted on geographies consisting of 196,398,604 people shows a moderate negative correlation between the proportion of Immigrants from Scotland and percentage of population with cognitive disability in the United States with a correlation coefficient (R) of -0.452 and weighted average of 16.2%, a difference of 2.8%.
Cognitive Disability Correlation Summary
| Measurement | Immigrants from Uzbekistan | Immigrants from Scotland |
| Minimum | 2.3% | 2.7% |
| Maximum | 32.0% | 24.7% |
| Range | 29.7% | 22.0% |
| Mean | 15.7% | 13.3% |
| Median | 15.7% | 14.3% |
| Interquartile 25% (IQ1) | 13.9% | 10.7% |
| Interquartile 75% (IQ3) | 17.6% | 15.5% |
| Interquartile Range (IQR) | 3.7% | 4.8% |
| Standard Deviation (Sample) | 4.1% | 4.1% |
| Standard Deviation (Population) | 4.0% | 4.1% |
Similar Demographics by Cognitive Disability
Demographics Similar to Immigrants from Uzbekistan by Cognitive Disability
In terms of cognitive disability, the demographic groups most similar to Immigrants from Uzbekistan are Immigrants from Sweden (16.7%, a difference of 0.010%), Immigrants from Belgium (16.7%, a difference of 0.020%), German (16.7%, a difference of 0.040%), Burmese (16.7%, a difference of 0.040%), and Slavic (16.7%, a difference of 0.050%).
| Demographics | Rating | Rank | Cognitive Disability |
| Czechoslovakians | 99.6 /100 | #62 | Exceptional 16.6% |
| Argentineans | 99.6 /100 | #63 | Exceptional 16.6% |
| Venezuelans | 99.6 /100 | #64 | Exceptional 16.6% |
| Colombians | 99.6 /100 | #65 | Exceptional 16.6% |
| Immigrants | Ukraine | 99.5 /100 | #66 | Exceptional 16.6% |
| Latvians | 99.5 /100 | #67 | Exceptional 16.6% |
| Ukrainians | 99.4 /100 | #68 | Exceptional 16.6% |
| Immigrants | Uzbekistan | 99.4 /100 | #69 | Exceptional 16.7% |
| Immigrants | Sweden | 99.4 /100 | #70 | Exceptional 16.7% |
| Immigrants | Belgium | 99.3 /100 | #71 | Exceptional 16.7% |
| Germans | 99.3 /100 | #72 | Exceptional 16.7% |
| Burmese | 99.3 /100 | #73 | Exceptional 16.7% |
| Slavs | 99.3 /100 | #74 | Exceptional 16.7% |
| Estonians | 99.3 /100 | #75 | Exceptional 16.7% |
| Immigrants | Serbia | 99.3 /100 | #76 | Exceptional 16.7% |
Demographics Similar to Immigrants from Scotland by Cognitive Disability
In terms of cognitive disability, the demographic groups most similar to Immigrants from Scotland are Assyrian/Chaldean/Syriac (16.2%, a difference of 0.040%), Immigrants from Czechoslovakia (16.2%, a difference of 0.080%), Maltese (16.2%, a difference of 0.25%), Lithuanian (16.3%, a difference of 0.34%), and Immigrants from Poland (16.1%, a difference of 0.36%).
| Demographics | Rating | Rank | Cognitive Disability |
| Chinese | 100.0 /100 | #3 | Exceptional 15.9% |
| Immigrants | Lithuania | 100.0 /100 | #4 | Exceptional 16.0% |
| Immigrants | Hong Kong | 100.0 /100 | #5 | Exceptional 16.0% |
| Thais | 100.0 /100 | #6 | Exceptional 16.1% |
| Immigrants | Ireland | 100.0 /100 | #7 | Exceptional 16.1% |
| Immigrants | Poland | 100.0 /100 | #8 | Exceptional 16.1% |
| Assyrians/Chaldeans/Syriacs | 100.0 /100 | #9 | Exceptional 16.2% |
| Immigrants | Scotland | 100.0 /100 | #10 | Exceptional 16.2% |
| Immigrants | Czechoslovakia | 100.0 /100 | #11 | Exceptional 16.2% |
| Maltese | 100.0 /100 | #12 | Exceptional 16.2% |
| Lithuanians | 100.0 /100 | #13 | Exceptional 16.3% |
| Immigrants | Austria | 100.0 /100 | #14 | Exceptional 16.3% |
| Immigrants | Greece | 100.0 /100 | #15 | Exceptional 16.3% |
| Eastern Europeans | 100.0 /100 | #16 | Exceptional 16.3% |
| Immigrants | North Macedonia | 100.0 /100 | #17 | Exceptional 16.3% |