Immigrants from Uzbekistan vs Immigrants from Turkey 3 or more Vehicles in Household
COMPARE
Immigrants from Uzbekistan
Immigrants from Turkey
3 or more Vehicles in Household
3 or more Vehicles in Household Comparison
Immigrants from Uzbekistan
Immigrants from Turkey
12.0%
3 OR MORE VEHICLES IN HOUSEHOLD
0.0/ 100
METRIC RATING
339th/ 347
METRIC RANK
17.9%
3 OR MORE VEHICLES IN HOUSEHOLD
1.2/ 100
METRIC RATING
255th/ 347
METRIC RANK
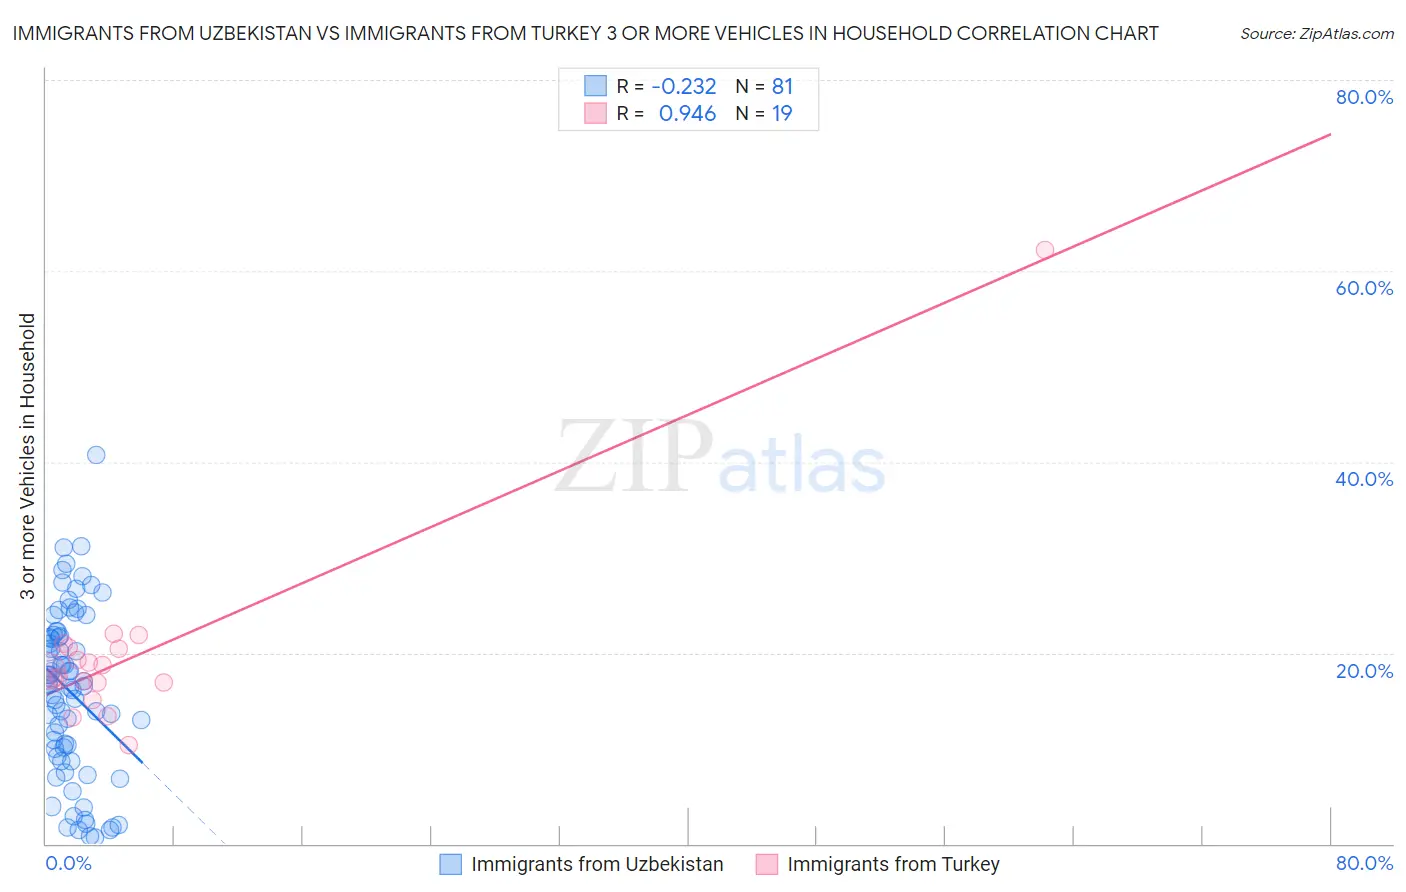
Immigrants from Uzbekistan vs Immigrants from Turkey 3 or more Vehicles in Household Correlation Chart
The statistical analysis conducted on geographies consisting of 118,708,326 people shows a weak negative correlation between the proportion of Immigrants from Uzbekistan and percentage of households with 3 or more vehicles available in the United States with a correlation coefficient (R) of -0.232 and weighted average of 12.0%. Similarly, the statistical analysis conducted on geographies consisting of 222,920,746 people shows a near-perfect positive correlation between the proportion of Immigrants from Turkey and percentage of households with 3 or more vehicles available in the United States with a correlation coefficient (R) of 0.946 and weighted average of 17.9%, a difference of 49.2%.
3 or more Vehicles in Household Correlation Summary
| Measurement | Immigrants from Uzbekistan | Immigrants from Turkey |
| Minimum | 0.69% | 10.4% |
| Maximum | 40.7% | 62.2% |
| Range | 40.0% | 51.8% |
| Mean | 15.9% | 20.0% |
| Median | 16.7% | 18.0% |
| Interquartile 25% (IQ1) | 9.6% | 16.8% |
| Interquartile 75% (IQ3) | 21.8% | 20.6% |
| Interquartile Range (IQR) | 12.2% | 3.7% |
| Standard Deviation (Sample) | 8.7% | 10.7% |
| Standard Deviation (Population) | 8.7% | 10.4% |
Similar Demographics by 3 or more Vehicles in Household
Demographics Similar to Immigrants from Uzbekistan by 3 or more Vehicles in Household
In terms of 3 or more vehicles in household, the demographic groups most similar to Immigrants from Uzbekistan are Immigrants from Barbados (11.7%, a difference of 2.2%), Vietnamese (12.5%, a difference of 3.9%), Immigrants from Bangladesh (12.5%, a difference of 4.4%), Guyanese (11.5%, a difference of 4.7%), and British West Indian (11.4%, a difference of 4.7%).
| Demographics | Rating | Rank | 3 or more Vehicles in Household |
| Trinidadians and Tobagonians | 0.0 /100 | #332 | Tragic 13.6% |
| Immigrants | Cabo Verde | 0.0 /100 | #333 | Tragic 13.6% |
| Immigrants | Ecuador | 0.0 /100 | #334 | Tragic 13.4% |
| Immigrants | Trinidad and Tobago | 0.0 /100 | #335 | Tragic 13.3% |
| Barbadians | 0.0 /100 | #336 | Tragic 12.6% |
| Immigrants | Bangladesh | 0.0 /100 | #337 | Tragic 12.5% |
| Vietnamese | 0.0 /100 | #338 | Tragic 12.5% |
| Immigrants | Uzbekistan | 0.0 /100 | #339 | Tragic 12.0% |
| Immigrants | Barbados | 0.0 /100 | #340 | Tragic 11.7% |
| Guyanese | 0.0 /100 | #341 | Tragic 11.5% |
| British West Indians | 0.0 /100 | #342 | Tragic 11.4% |
| Immigrants | Guyana | 0.0 /100 | #343 | Tragic 11.2% |
| Dominicans | 0.0 /100 | #344 | Tragic 11.2% |
| Immigrants | Dominican Republic | 0.0 /100 | #345 | Tragic 10.4% |
| Immigrants | St. Vincent and the Grenadines | 0.0 /100 | #346 | Tragic 10.1% |
Demographics Similar to Immigrants from Turkey by 3 or more Vehicles in Household
In terms of 3 or more vehicles in household, the demographic groups most similar to Immigrants from Turkey are Immigrants from Ethiopia (17.9%, a difference of 0.030%), Ethiopian (17.9%, a difference of 0.030%), Subsaharan African (17.9%, a difference of 0.15%), Immigrants from Eritrea (17.8%, a difference of 0.20%), and Sudanese (17.8%, a difference of 0.20%).
| Demographics | Rating | Rank | 3 or more Vehicles in Household |
| Immigrants | Eastern Africa | 1.8 /100 | #248 | Tragic 18.0% |
| Immigrants | Saudi Arabia | 1.7 /100 | #249 | Tragic 18.0% |
| Venezuelans | 1.7 /100 | #250 | Tragic 18.0% |
| Alsatians | 1.5 /100 | #251 | Tragic 18.0% |
| Immigrants | Southern Europe | 1.4 /100 | #252 | Tragic 17.9% |
| Immigrants | Ethiopia | 1.3 /100 | #253 | Tragic 17.9% |
| Ethiopians | 1.2 /100 | #254 | Tragic 17.9% |
| Immigrants | Turkey | 1.2 /100 | #255 | Tragic 17.9% |
| Sub-Saharan Africans | 1.1 /100 | #256 | Tragic 17.9% |
| Immigrants | Eritrea | 1.1 /100 | #257 | Tragic 17.8% |
| Sudanese | 1.1 /100 | #258 | Tragic 17.8% |
| Uruguayans | 1.0 /100 | #259 | Tragic 17.8% |
| Ugandans | 0.9 /100 | #260 | Tragic 17.8% |
| Immigrants | Northern Africa | 0.9 /100 | #261 | Tragic 17.8% |
| Colombians | 0.9 /100 | #262 | Tragic 17.8% |