Immigrants from Uganda vs Immigrants from South America College, Under 1 year
COMPARE
Immigrants from Uganda
Immigrants from South America
College, Under 1 year
College, Under 1 year Comparison
Immigrants from Uganda
Immigrants from South America
66.5%
COLLEGE, UNDER 1 YEAR
82.8/ 100
METRIC RATING
143rd/ 347
METRIC RANK
63.8%
COLLEGE, UNDER 1 YEAR
9.1/ 100
METRIC RATING
213th/ 347
METRIC RANK
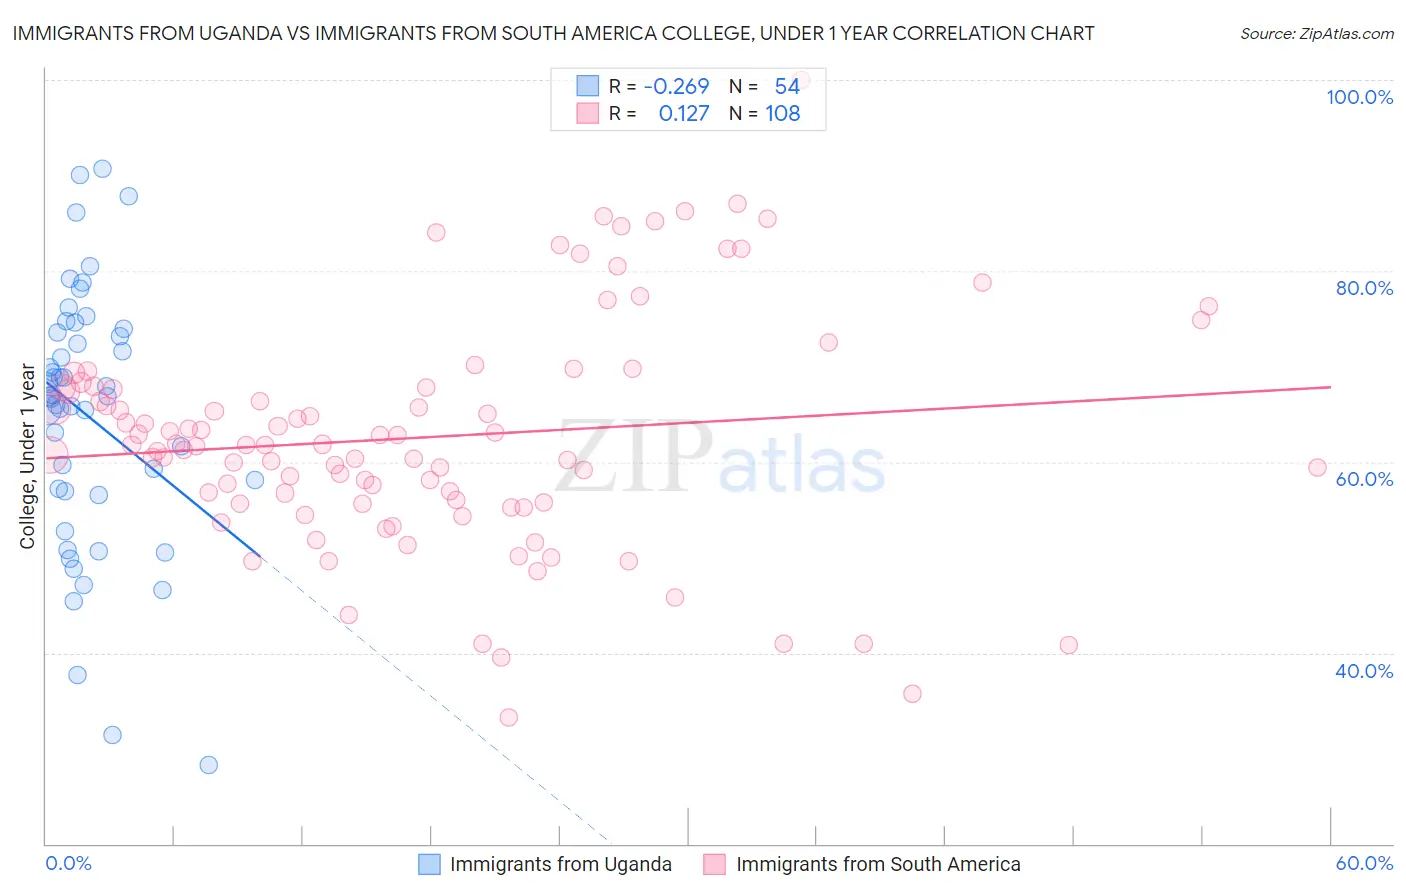
Immigrants from Uganda vs Immigrants from South America College, Under 1 year Correlation Chart
The statistical analysis conducted on geographies consisting of 125,982,535 people shows a weak negative correlation between the proportion of Immigrants from Uganda and percentage of population with at least college, under 1 year education in the United States with a correlation coefficient (R) of -0.269 and weighted average of 66.5%. Similarly, the statistical analysis conducted on geographies consisting of 486,373,097 people shows a poor positive correlation between the proportion of Immigrants from South America and percentage of population with at least college, under 1 year education in the United States with a correlation coefficient (R) of 0.127 and weighted average of 63.8%, a difference of 4.4%.
College, Under 1 year Correlation Summary
| Measurement | Immigrants from Uganda | Immigrants from South America |
| Minimum | 28.3% | 33.3% |
| Maximum | 90.7% | 100.0% |
| Range | 62.4% | 66.7% |
| Mean | 64.8% | 62.6% |
| Median | 66.8% | 61.8% |
| Interquartile 25% (IQ1) | 57.0% | 55.7% |
| Interquartile 75% (IQ3) | 73.5% | 67.8% |
| Interquartile Range (IQR) | 16.6% | 12.1% |
| Standard Deviation (Sample) | 13.6% | 12.1% |
| Standard Deviation (Population) | 13.5% | 12.0% |
Similar Demographics by College, Under 1 year
Demographics Similar to Immigrants from Uganda by College, Under 1 year
In terms of college, under 1 year, the demographic groups most similar to Immigrants from Uganda are English (66.6%, a difference of 0.010%), Immigrants from Germany (66.5%, a difference of 0.060%), Immigrants from Kenya (66.5%, a difference of 0.070%), Kenyan (66.5%, a difference of 0.080%), and Immigrants from Morocco (66.5%, a difference of 0.080%).
| Demographics | Rating | Rank | College, Under 1 year |
| Ugandans | 87.8 /100 | #136 | Excellent 66.8% |
| Immigrants | Chile | 87.4 /100 | #137 | Excellent 66.8% |
| Immigrants | Italy | 86.9 /100 | #138 | Excellent 66.8% |
| Venezuelans | 85.9 /100 | #139 | Excellent 66.7% |
| Slavs | 85.9 /100 | #140 | Excellent 66.7% |
| Immigrants | Afghanistan | 85.1 /100 | #141 | Excellent 66.7% |
| English | 82.9 /100 | #142 | Excellent 66.6% |
| Immigrants | Uganda | 82.8 /100 | #143 | Excellent 66.5% |
| Immigrants | Germany | 82.0 /100 | #144 | Excellent 66.5% |
| Immigrants | Kenya | 81.8 /100 | #145 | Excellent 66.5% |
| Kenyans | 81.7 /100 | #146 | Excellent 66.5% |
| Immigrants | Morocco | 81.7 /100 | #147 | Excellent 66.5% |
| Taiwanese | 78.6 /100 | #148 | Good 66.4% |
| Immigrants | Venezuela | 77.9 /100 | #149 | Good 66.3% |
| Immigrants | Iraq | 77.1 /100 | #150 | Good 66.3% |
Demographics Similar to Immigrants from South America by College, Under 1 year
In terms of college, under 1 year, the demographic groups most similar to Immigrants from South America are Immigrants from Nigeria (63.7%, a difference of 0.040%), Immigrants from Middle Africa (63.9%, a difference of 0.18%), Native Hawaiian (63.9%, a difference of 0.19%), Senegalese (63.6%, a difference of 0.21%), and Ghanaian (63.9%, a difference of 0.26%).
| Demographics | Rating | Rank | College, Under 1 year |
| Whites/Caucasians | 12.8 /100 | #206 | Poor 64.0% |
| Colombians | 12.4 /100 | #207 | Poor 64.0% |
| Immigrants | Vietnam | 12.1 /100 | #208 | Poor 64.0% |
| Puget Sound Salish | 11.3 /100 | #209 | Poor 63.9% |
| Ghanaians | 11.2 /100 | #210 | Poor 63.9% |
| Native Hawaiians | 10.6 /100 | #211 | Poor 63.9% |
| Immigrants | Middle Africa | 10.5 /100 | #212 | Poor 63.9% |
| Immigrants | South America | 9.1 /100 | #213 | Tragic 63.8% |
| Immigrants | Nigeria | 8.8 /100 | #214 | Tragic 63.7% |
| Senegalese | 7.7 /100 | #215 | Tragic 63.6% |
| Hmong | 6.8 /100 | #216 | Tragic 63.5% |
| Immigrants | Uruguay | 5.8 /100 | #217 | Tragic 63.4% |
| Immigrants | Panama | 5.7 /100 | #218 | Tragic 63.4% |
| Immigrants | Fiji | 5.7 /100 | #219 | Tragic 63.4% |
| Portuguese | 5.6 /100 | #220 | Tragic 63.4% |