Soviet Union vs Immigrants from South America 3 or more Vehicles in Household
COMPARE
Soviet Union
Immigrants from South America
3 or more Vehicles in Household
3 or more Vehicles in Household Comparison
Soviet Union
Immigrants from South America
14.2%
3 OR MORE VEHICLES IN HOUSEHOLD
0.0/ 100
METRIC RATING
326th/ 347
METRIC RANK
16.7%
3 OR MORE VEHICLES IN HOUSEHOLD
0.1/ 100
METRIC RATING
299th/ 347
METRIC RANK
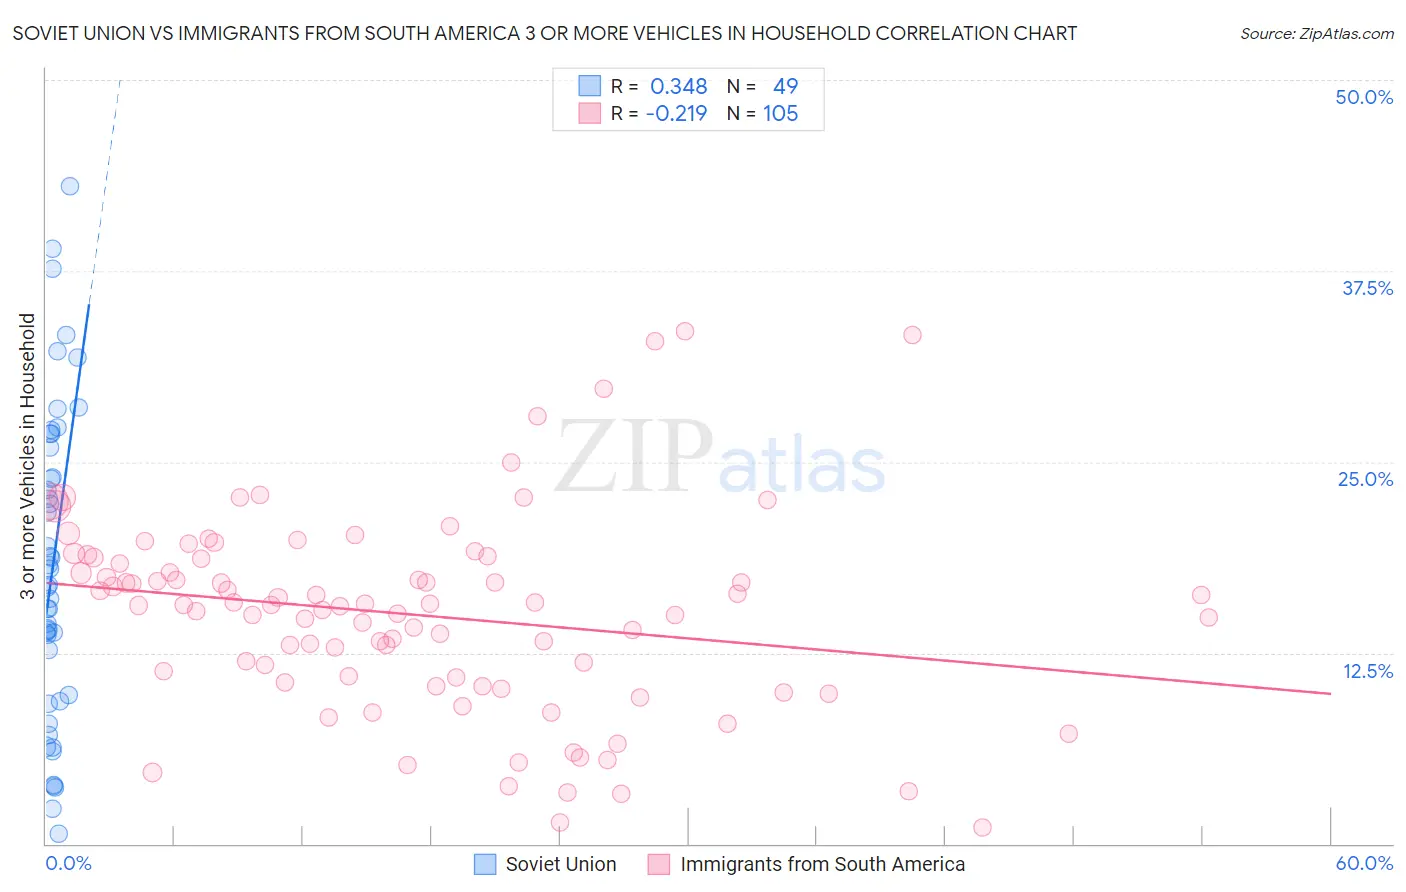
Soviet Union vs Immigrants from South America 3 or more Vehicles in Household Correlation Chart
The statistical analysis conducted on geographies consisting of 43,505,589 people shows a mild positive correlation between the proportion of Soviet Union and percentage of households with 3 or more vehicles available in the United States with a correlation coefficient (R) of 0.348 and weighted average of 14.2%. Similarly, the statistical analysis conducted on geographies consisting of 485,824,151 people shows a weak negative correlation between the proportion of Immigrants from South America and percentage of households with 3 or more vehicles available in the United States with a correlation coefficient (R) of -0.219 and weighted average of 16.7%, a difference of 17.8%.
3 or more Vehicles in Household Correlation Summary
| Measurement | Soviet Union | Immigrants from South America |
| Minimum | 0.69% | 1.1% |
| Maximum | 43.0% | 33.5% |
| Range | 42.4% | 32.4% |
| Mean | 18.2% | 15.0% |
| Median | 16.9% | 15.6% |
| Interquartile 25% (IQ1) | 9.5% | 10.7% |
| Interquartile 75% (IQ3) | 26.4% | 18.7% |
| Interquartile Range (IQR) | 16.8% | 8.0% |
| Standard Deviation (Sample) | 10.2% | 6.5% |
| Standard Deviation (Population) | 10.1% | 6.4% |
Similar Demographics by 3 or more Vehicles in Household
Demographics Similar to Soviet Union by 3 or more Vehicles in Household
In terms of 3 or more vehicles in household, the demographic groups most similar to Soviet Union are Senegalese (14.2%, a difference of 0.33%), Immigrants from Yemen (14.2%, a difference of 0.41%), Ecuadorian (14.1%, a difference of 0.89%), Immigrants from Albania (14.0%, a difference of 1.6%), and Immigrants from Caribbean (14.6%, a difference of 2.7%).
| Demographics | Rating | Rank | 3 or more Vehicles in Household |
| Cape Verdeans | 0.0 /100 | #319 | Tragic 15.0% |
| Yup'ik | 0.0 /100 | #320 | Tragic 14.8% |
| Immigrants | Jamaica | 0.0 /100 | #321 | Tragic 14.7% |
| Immigrants | West Indies | 0.0 /100 | #322 | Tragic 14.6% |
| Immigrants | Caribbean | 0.0 /100 | #323 | Tragic 14.6% |
| Immigrants | Yemen | 0.0 /100 | #324 | Tragic 14.2% |
| Senegalese | 0.0 /100 | #325 | Tragic 14.2% |
| Soviet Union | 0.0 /100 | #326 | Tragic 14.2% |
| Ecuadorians | 0.0 /100 | #327 | Tragic 14.1% |
| Immigrants | Albania | 0.0 /100 | #328 | Tragic 14.0% |
| Immigrants | Senegal | 0.0 /100 | #329 | Tragic 13.8% |
| West Indians | 0.0 /100 | #330 | Tragic 13.7% |
| Immigrants | Dominica | 0.0 /100 | #331 | Tragic 13.7% |
| Trinidadians and Tobagonians | 0.0 /100 | #332 | Tragic 13.6% |
| Immigrants | Cabo Verde | 0.0 /100 | #333 | Tragic 13.6% |
Demographics Similar to Immigrants from South America by 3 or more Vehicles in Household
In terms of 3 or more vehicles in household, the demographic groups most similar to Immigrants from South America are Immigrants from Zaire (16.7%, a difference of 0.060%), Israeli (16.8%, a difference of 0.43%), Cypriot (16.6%, a difference of 0.48%), Paraguayan (16.6%, a difference of 0.89%), and Inupiat (16.9%, a difference of 0.90%).
| Demographics | Rating | Rank | 3 or more Vehicles in Household |
| Immigrants | Spain | 0.1 /100 | #292 | Tragic 17.0% |
| Bahamians | 0.1 /100 | #293 | Tragic 16.9% |
| Immigrants | Western Africa | 0.1 /100 | #294 | Tragic 16.9% |
| Immigrants | Russia | 0.1 /100 | #295 | Tragic 16.9% |
| Inupiat | 0.1 /100 | #296 | Tragic 16.9% |
| Israelis | 0.1 /100 | #297 | Tragic 16.8% |
| Immigrants | Zaire | 0.1 /100 | #298 | Tragic 16.7% |
| Immigrants | South America | 0.1 /100 | #299 | Tragic 16.7% |
| Cypriots | 0.0 /100 | #300 | Tragic 16.6% |
| Paraguayans | 0.0 /100 | #301 | Tragic 16.6% |
| Immigrants | Greece | 0.0 /100 | #302 | Tragic 16.5% |
| Immigrants | Serbia | 0.0 /100 | #303 | Tragic 16.4% |
| Ghanaians | 0.0 /100 | #304 | Tragic 16.4% |
| Immigrants | Morocco | 0.0 /100 | #305 | Tragic 16.3% |
| Somalis | 0.0 /100 | #306 | Tragic 16.2% |