Immigrants from Taiwan vs Immigrants from Croatia 2 or more Vehicles in Household
COMPARE
Immigrants from Taiwan
Immigrants from Croatia
2 or more Vehicles in Household
2 or more Vehicles in Household Comparison
Immigrants from Taiwan
Immigrants from Croatia
59.7%
2 OR MORE VEHICLES IN HOUSEHOLD
100.0/ 100
METRIC RATING
45th/ 347
METRIC RANK
51.8%
2 OR MORE VEHICLES IN HOUSEHOLD
0.2/ 100
METRIC RATING
276th/ 347
METRIC RANK
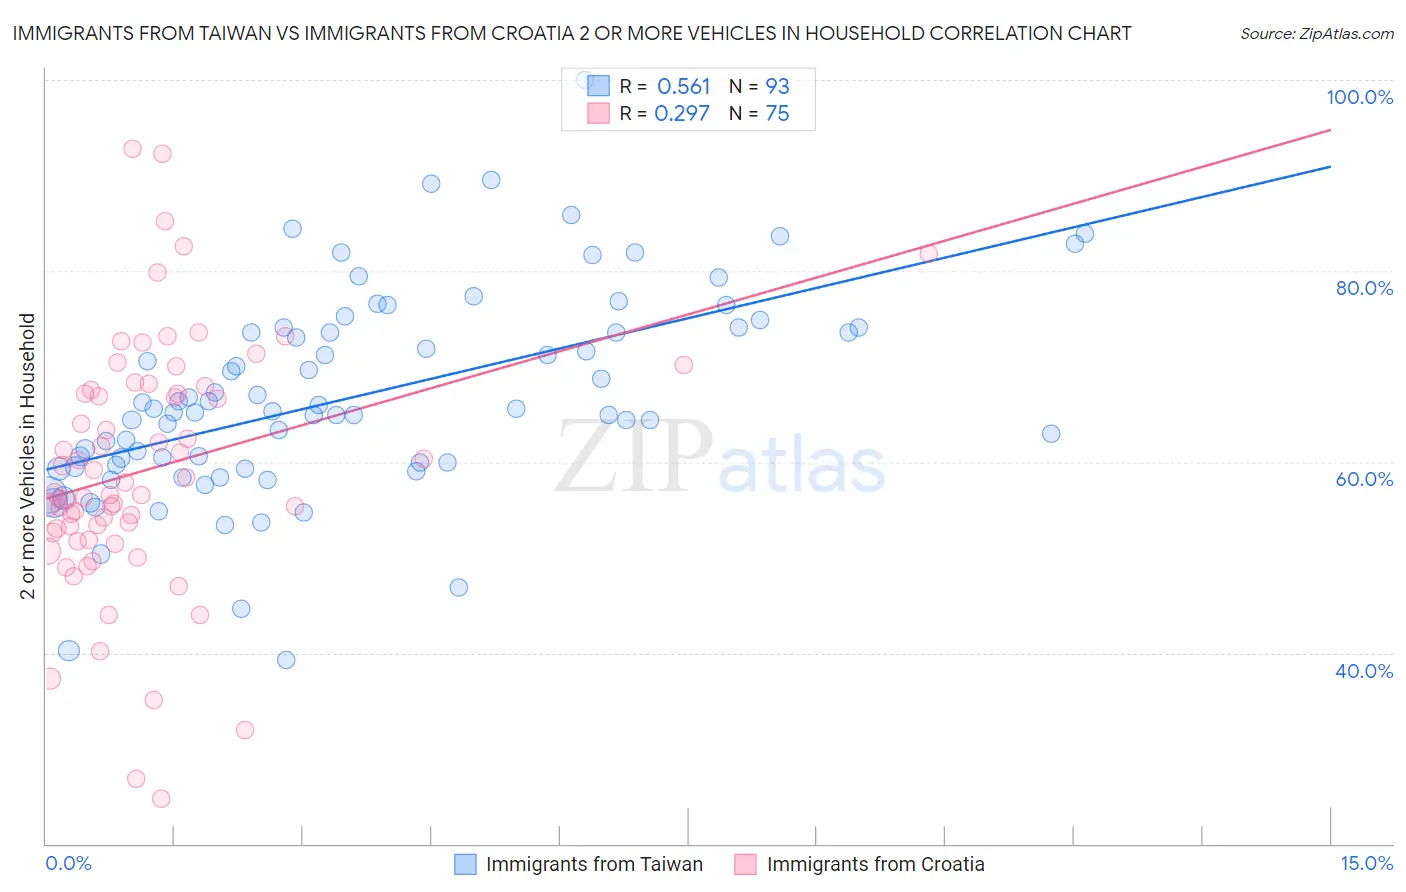
Immigrants from Taiwan vs Immigrants from Croatia 2 or more Vehicles in Household Correlation Chart
The statistical analysis conducted on geographies consisting of 298,141,678 people shows a substantial positive correlation between the proportion of Immigrants from Taiwan and percentage of households with 2 or more vehicles available in the United States with a correlation coefficient (R) of 0.561 and weighted average of 59.7%. Similarly, the statistical analysis conducted on geographies consisting of 132,533,947 people shows a weak positive correlation between the proportion of Immigrants from Croatia and percentage of households with 2 or more vehicles available in the United States with a correlation coefficient (R) of 0.297 and weighted average of 51.8%, a difference of 15.3%.
2 or more Vehicles in Household Correlation Summary
| Measurement | Immigrants from Taiwan | Immigrants from Croatia |
| Minimum | 39.2% | 24.7% |
| Maximum | 100.0% | 92.9% |
| Range | 60.8% | 68.1% |
| Mean | 66.8% | 59.2% |
| Median | 65.3% | 56.8% |
| Interquartile 25% (IQ1) | 59.6% | 52.6% |
| Interquartile 75% (IQ3) | 73.8% | 67.5% |
| Interquartile Range (IQR) | 14.2% | 14.8% |
| Standard Deviation (Sample) | 10.8% | 13.1% |
| Standard Deviation (Population) | 10.7% | 13.0% |
Similar Demographics by 2 or more Vehicles in Household
Demographics Similar to Immigrants from Taiwan by 2 or more Vehicles in Household
In terms of 2 or more vehicles in household, the demographic groups most similar to Immigrants from Taiwan are French (59.8%, a difference of 0.040%), Czechoslovakian (59.8%, a difference of 0.10%), Malaysian (59.8%, a difference of 0.18%), Northern European (59.9%, a difference of 0.19%), and Cherokee (59.9%, a difference of 0.21%).
| Demographics | Rating | Rank | 2 or more Vehicles in Household |
| Americans | 100.0 /100 | #38 | Exceptional 60.0% |
| British | 100.0 /100 | #39 | Exceptional 60.0% |
| Cherokee | 100.0 /100 | #40 | Exceptional 59.9% |
| Northern Europeans | 100.0 /100 | #41 | Exceptional 59.9% |
| Malaysians | 100.0 /100 | #42 | Exceptional 59.8% |
| Czechoslovakians | 100.0 /100 | #43 | Exceptional 59.8% |
| French | 100.0 /100 | #44 | Exceptional 59.8% |
| Immigrants | Taiwan | 100.0 /100 | #45 | Exceptional 59.7% |
| Immigrants | South Eastern Asia | 100.0 /100 | #46 | Exceptional 59.6% |
| Yaqui | 99.9 /100 | #47 | Exceptional 59.3% |
| Immigrants | India | 99.9 /100 | #48 | Exceptional 59.3% |
| Belgians | 99.9 /100 | #49 | Exceptional 59.3% |
| Choctaw | 99.9 /100 | #50 | Exceptional 59.3% |
| Spaniards | 99.9 /100 | #51 | Exceptional 59.2% |
| Immigrants | Laos | 99.9 /100 | #52 | Exceptional 59.2% |
Demographics Similar to Immigrants from Croatia by 2 or more Vehicles in Household
In terms of 2 or more vehicles in household, the demographic groups most similar to Immigrants from Croatia are Immigrants from Honduras (51.8%, a difference of 0.030%), African (51.8%, a difference of 0.040%), Immigrants from Africa (51.8%, a difference of 0.050%), Israeli (51.9%, a difference of 0.090%), and Yuman (51.7%, a difference of 0.12%).
| Demographics | Rating | Rank | 2 or more Vehicles in Household |
| Hondurans | 0.2 /100 | #269 | Tragic 52.0% |
| Immigrants | Ireland | 0.2 /100 | #270 | Tragic 52.0% |
| South Americans | 0.2 /100 | #271 | Tragic 51.9% |
| Sub-Saharan Africans | 0.2 /100 | #272 | Tragic 51.9% |
| Israelis | 0.2 /100 | #273 | Tragic 51.9% |
| Africans | 0.2 /100 | #274 | Tragic 51.8% |
| Immigrants | Honduras | 0.2 /100 | #275 | Tragic 51.8% |
| Immigrants | Croatia | 0.2 /100 | #276 | Tragic 51.8% |
| Immigrants | Africa | 0.2 /100 | #277 | Tragic 51.8% |
| Yuman | 0.1 /100 | #278 | Tragic 51.7% |
| Liberians | 0.1 /100 | #279 | Tragic 51.7% |
| Immigrants | Eastern Europe | 0.1 /100 | #280 | Tragic 51.7% |
| Immigrants | Kazakhstan | 0.1 /100 | #281 | Tragic 51.6% |
| Bahamians | 0.1 /100 | #282 | Tragic 51.5% |
| Immigrants | China | 0.1 /100 | #283 | Tragic 51.5% |