Immigrants from Laos vs Immigrants from Croatia 2 or more Vehicles in Household
COMPARE
Immigrants from Laos
Immigrants from Croatia
2 or more Vehicles in Household
2 or more Vehicles in Household Comparison
Immigrants from Laos
Immigrants from Croatia
59.2%
2 OR MORE VEHICLES IN HOUSEHOLD
99.9/ 100
METRIC RATING
52nd/ 347
METRIC RANK
51.8%
2 OR MORE VEHICLES IN HOUSEHOLD
0.2/ 100
METRIC RATING
276th/ 347
METRIC RANK
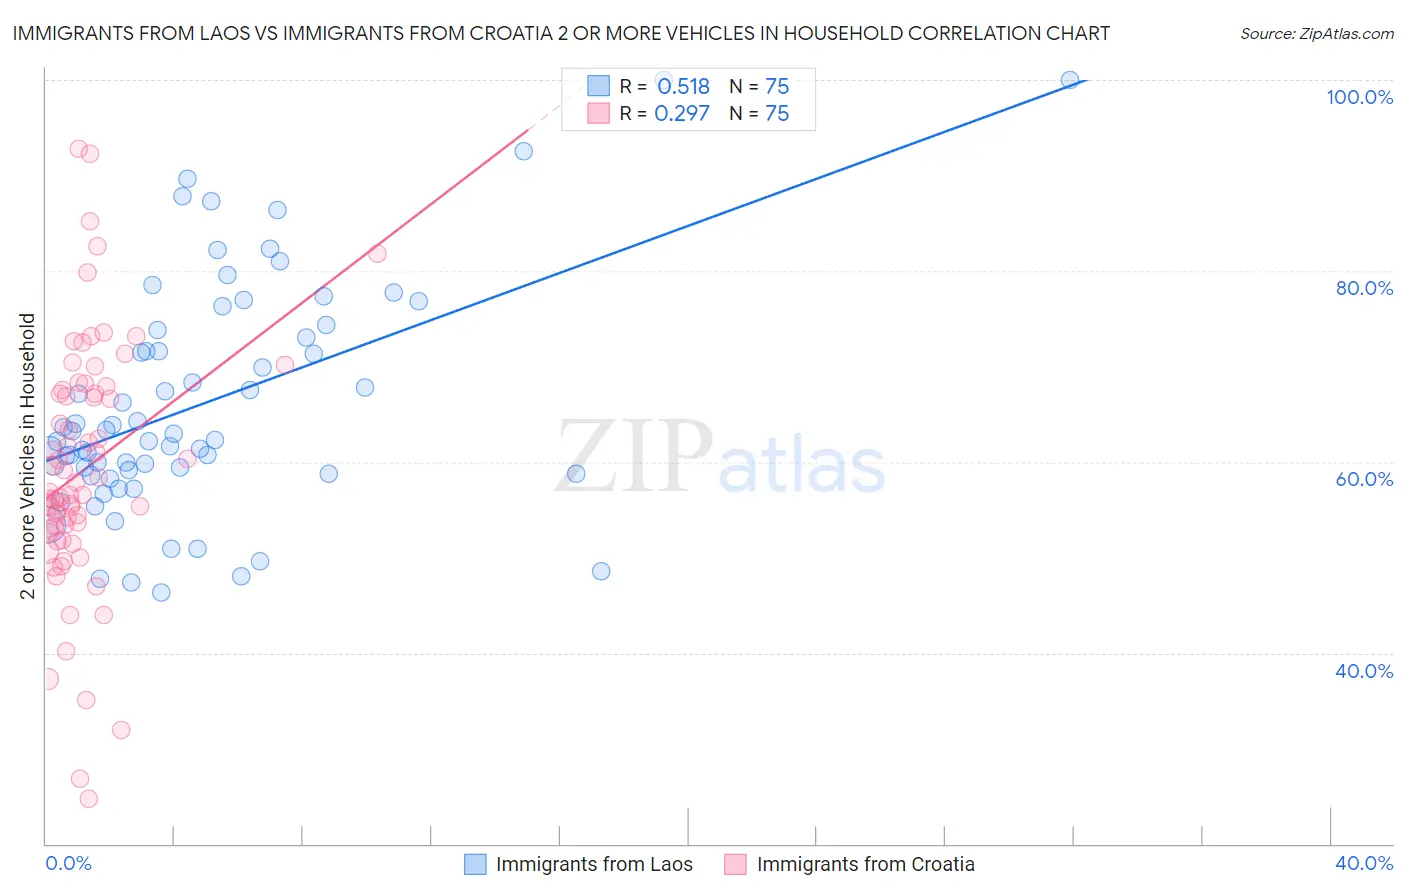
Immigrants from Laos vs Immigrants from Croatia 2 or more Vehicles in Household Correlation Chart
The statistical analysis conducted on geographies consisting of 201,468,892 people shows a substantial positive correlation between the proportion of Immigrants from Laos and percentage of households with 2 or more vehicles available in the United States with a correlation coefficient (R) of 0.518 and weighted average of 59.2%. Similarly, the statistical analysis conducted on geographies consisting of 132,533,947 people shows a weak positive correlation between the proportion of Immigrants from Croatia and percentage of households with 2 or more vehicles available in the United States with a correlation coefficient (R) of 0.297 and weighted average of 51.8%, a difference of 14.2%.
2 or more Vehicles in Household Correlation Summary
| Measurement | Immigrants from Laos | Immigrants from Croatia |
| Minimum | 46.3% | 24.7% |
| Maximum | 100.0% | 92.9% |
| Range | 53.7% | 68.1% |
| Mean | 66.2% | 59.2% |
| Median | 63.0% | 56.8% |
| Interquartile 25% (IQ1) | 58.8% | 52.6% |
| Interquartile 75% (IQ3) | 73.9% | 67.5% |
| Interquartile Range (IQR) | 15.1% | 14.8% |
| Standard Deviation (Sample) | 12.2% | 13.1% |
| Standard Deviation (Population) | 12.1% | 13.0% |
Similar Demographics by 2 or more Vehicles in Household
Demographics Similar to Immigrants from Laos by 2 or more Vehicles in Household
In terms of 2 or more vehicles in household, the demographic groups most similar to Immigrants from Laos are Spaniard (59.2%, a difference of 0.0%), Celtic (59.2%, a difference of 0.010%), Choctaw (59.3%, a difference of 0.14%), Belgian (59.3%, a difference of 0.15%), and Bhutanese (59.1%, a difference of 0.16%).
| Demographics | Rating | Rank | 2 or more Vehicles in Household |
| Immigrants | Taiwan | 100.0 /100 | #45 | Exceptional 59.7% |
| Immigrants | South Eastern Asia | 100.0 /100 | #46 | Exceptional 59.6% |
| Yaqui | 99.9 /100 | #47 | Exceptional 59.3% |
| Immigrants | India | 99.9 /100 | #48 | Exceptional 59.3% |
| Belgians | 99.9 /100 | #49 | Exceptional 59.3% |
| Choctaw | 99.9 /100 | #50 | Exceptional 59.3% |
| Spaniards | 99.9 /100 | #51 | Exceptional 59.2% |
| Immigrants | Laos | 99.9 /100 | #52 | Exceptional 59.2% |
| Celtics | 99.9 /100 | #53 | Exceptional 59.2% |
| Bhutanese | 99.9 /100 | #54 | Exceptional 59.1% |
| Luxembourgers | 99.9 /100 | #55 | Exceptional 59.1% |
| Chickasaw | 99.9 /100 | #56 | Exceptional 59.0% |
| Afghans | 99.9 /100 | #57 | Exceptional 59.0% |
| Immigrants | Scotland | 99.8 /100 | #58 | Exceptional 58.9% |
| Spanish Americans | 99.8 /100 | #59 | Exceptional 58.9% |
Demographics Similar to Immigrants from Croatia by 2 or more Vehicles in Household
In terms of 2 or more vehicles in household, the demographic groups most similar to Immigrants from Croatia are Immigrants from Honduras (51.8%, a difference of 0.030%), African (51.8%, a difference of 0.040%), Immigrants from Africa (51.8%, a difference of 0.050%), Israeli (51.9%, a difference of 0.090%), and Yuman (51.7%, a difference of 0.12%).
| Demographics | Rating | Rank | 2 or more Vehicles in Household |
| Hondurans | 0.2 /100 | #269 | Tragic 52.0% |
| Immigrants | Ireland | 0.2 /100 | #270 | Tragic 52.0% |
| South Americans | 0.2 /100 | #271 | Tragic 51.9% |
| Sub-Saharan Africans | 0.2 /100 | #272 | Tragic 51.9% |
| Israelis | 0.2 /100 | #273 | Tragic 51.9% |
| Africans | 0.2 /100 | #274 | Tragic 51.8% |
| Immigrants | Honduras | 0.2 /100 | #275 | Tragic 51.8% |
| Immigrants | Croatia | 0.2 /100 | #276 | Tragic 51.8% |
| Immigrants | Africa | 0.2 /100 | #277 | Tragic 51.8% |
| Yuman | 0.1 /100 | #278 | Tragic 51.7% |
| Liberians | 0.1 /100 | #279 | Tragic 51.7% |
| Immigrants | Eastern Europe | 0.1 /100 | #280 | Tragic 51.7% |
| Immigrants | Kazakhstan | 0.1 /100 | #281 | Tragic 51.6% |
| Bahamians | 0.1 /100 | #282 | Tragic 51.5% |
| Immigrants | China | 0.1 /100 | #283 | Tragic 51.5% |